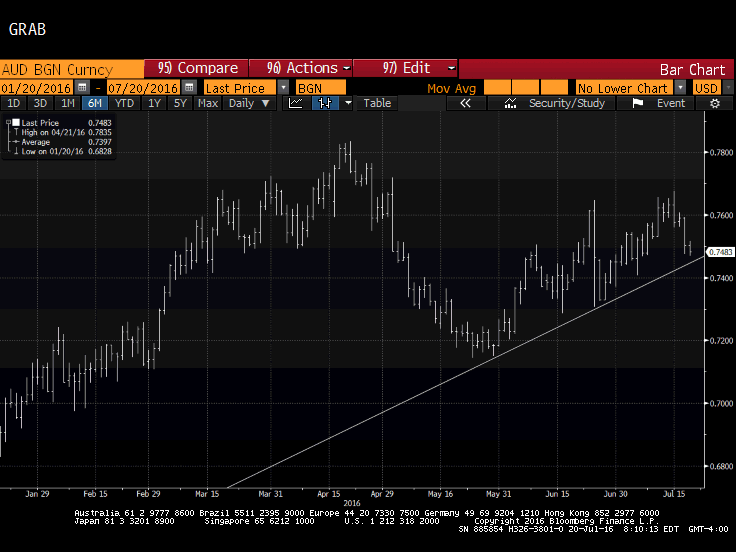
Summary: Australian dollar is the second heaviest currency this week after a key downside reversal at the end of last week. It is approaching an uptrend line near %excerpt%.7450. Many perceive an increased likelihood that the RBA eases and many are reassessing chance of a Fed hike later this year. Australian dollar The Australian dollar recorded a key downside reversal last Friday (July 15) and had seen follow through selling this week. It is off 1.25% over the past three sessions, which makes it the worst performing major currency behind the Japanese yen. As this Great Graphic, composed on Bloomberg shows, the recent losses have pushed to Australian dollar close to the uptrend line drawn off the late-May low near %excerpt%.7150 and the spike low from Brexit (~%excerpt%.7300). The trendline is found near %excerpt%.7450 today. The %excerpt%.7470 area the Aussie tested yesterday and today correspond to a 38.2% retracement of that advance since late-May. The 100-day moving average is near %excerpt%.7485. The 50% retracement is found a little ahead of %excerpt%.7410, and the 61.8% retracement is near %excerpt%.7350. Short-term speculators may be caught leaning the wrong way.
Topics:
Marc Chandler considers the following as important: AUD, Australian Dollar, Featured, FX Trends, Great Graphic, newslettersent, reserve, USD
This could be interesting, too:
Nachrichten Ticker - www.finanzen.ch writes Die Performance der Kryptowährungen in KW 9: Das hat sich bei Bitcoin, Ether & Co. getan
Nachrichten Ticker - www.finanzen.ch writes Wer verbirgt sich hinter der Ethereum-Technologie?
Marc Chandler writes March 2025 Monthly
Mark Thornton writes Is Amazon a Union-Busting Leviathan?
Summary:
Australian dollar is the second heaviest currency this week after a key downside reversal at the end of last week.
It is approaching an uptrend line near $0.7450.
Many perceive an increased likelihood that the RBA eases and many are reassessing chance of a Fed hike later this year.
Australian dollarThe Australian dollar recorded a key downside reversal last Friday (July 15) and had seen follow through selling this week. It is off 1.25% over the past three sessions, which makes it the worst performing major currency behind the Japanese yen.
As this Great Graphic, composed on Bloomberg shows, the recent losses have pushed to Australian dollar close to the uptrend line drawn off the late-May low near $0.7150 and the spike low from Brexit (~$0.7300). The trendline is found near $0.7450 today.
The $0.7470 area the Aussie tested yesterday and today correspond to a 38.2% retracement of that advance since late-May. The 100-day moving average is near $0.7485. The 50% retracement is found a little ahead of $0.7410, and the 61.8% retracement is near $0.7350.
Short-term speculators may be caught leaning the wrong way. In the CME futures, speculators have increased their gross long Australian dollar futures position by 40% over the past two reporting weeks to almost 46k contracts, the most in two months.
|

