Inside This Week's Bull Bear Report "Trump Trade" Sends Investors Into Overdrive How We Are Trading It Research Report -Paul Tudor Jones - I Won't Own Bonds Youtube - Before The Bell Market Statistics Stock Screens Portfolio Trades This Week A Pause That Refreshes? Last week, we discussed that with the election over and the Federal Reserve cutting interest rates, many market headwinds were put behind us. To wit; "As a result, the market surged higher, hitting our year-end target of 6000 on Friday. Furthermore, since election day, the "RE-risking" rally reversed the short-term sell signal, supporting higher prices. As we stated over the last few weeks, despite the many media-driven narratives, the underpinnings of the market remained bullish,
Topics:
Lance Roberts considers the following as important: 9) Personal Investment, 9a.) Real Investment Advice, Featured, newsletter
This could be interesting, too:
Nachrichten Ticker - www.finanzen.ch writes Die Performance der Kryptowährungen in KW 9: Das hat sich bei Bitcoin, Ether & Co. getan
Nachrichten Ticker - www.finanzen.ch writes Wer verbirgt sich hinter der Ethereum-Technologie?
Martin Hartmann writes Eine Analyse nach den Lehren von Milton Friedman
Marc Chandler writes March 2025 Monthly
Inside This Week's Bull Bear Report
- "Trump Trade" Sends Investors Into Overdrive
- How We Are Trading It
- Research Report -Paul Tudor Jones - I Won't Own Bonds
- Youtube - Before The Bell
- Market Statistics
- Stock Screens
- Portfolio Trades This Week
A Pause That Refreshes?
Last week, we discussed that with the election over and the Federal Reserve cutting interest rates, many market headwinds were put behind us. To wit;
"As a result, the market surged higher, hitting our year-end target of 6000 on Friday. Furthermore, since election day, the "RE-risking" rally reversed the short-term sell signal, supporting higher prices. As we stated over the last few weeks, despite the many media-driven narratives, the underpinnings of the market remained bullish, suggesting the recent pullback to the 50-DMA was a buying opportunity."
In that Bull Bear Report, we discussed the impact of the Trump Presidency on the financial markets based on expectations of tax cuts, tariffs, and deregulation. Since then, the "Trump Trade" went into full swing, pushing the markets higher; however, as we noted, that trade had gotten a bit ahead of itself, and we saw some consolidation and profit-taking this past week. Such is unsurprising given the return to overbought conditions with a more extreme deviation from the 50-DMA.

Furthermore, as noted in Friday's Daily Market Commentary:
"Technically, there is nothing wrong with the market. Yes, it is currently overbought, but the recent “choppy” action is beginning to work off some of that condition. I would expect a continuation of choppy performance into Thanksgiving, with a pop into the first week of December. That pop will be met by additional selling as mutual funds make their annual distributions, setting the market up for the year-end “Santa Claus” rally as managers window-dress for year-end reporting. In short, the trend is higher into year-end, but expect some bumps along the way."
While there are some short-term technical concerns, as discussed in "Seasonality: Buy Signals And Outcomes," there are three primary reasons to remain optimistic into year-end:
- Corporate share repurchases
- Performance Chasing
- Momentum
With the market now entering the seasonally strong period of the year, historical tendencies continue to support maintaining recommended target weights for equities in portfolios. However, as we will discuss this week, risks are building in certain market areas where "Trump Trade" exuberance has likely exceeded the grasp of underlying fundamental realities.
Need Help With Your Investing Strategy?
Are you looking for complete financial, insurance, and estate planning? Need a risk-managed portfolio management strategy to grow and protect your savings? Whatever your needs are, we are here to help.

"Trump Trade" Sends Investors Into Overdrive
It has been an interesting two weeks since the Presidential election. While investors were a bit skittish heading into the election, the clean Republican sweep of the Presidency, House, and Senate has sent investors scrambling to add exposure across all market assets. Here are a few charts courtesy of "The Daily Shot" that show the increase in investor speculation.
Small-capitalization stocks, the most susceptible to economic risk, surged higher on expectations that deregulation, further tax cuts, and tariffs will benefit small-caps, which tend to be heavily domestic-focused.

Since performance begets performance, momentum stocks were flooded with new investor capital.

But when it comes to pure "speculative" action, nothing denotes investor exuberance like the flows into UN-profitable technology companies.

Retail investors, who tend to perform poorly over time and make poor investment decisions, have piled into the same basket of "favorites" and "meme" stocks, like Gamestop. Which, just to remind you, it was those same stocks that nearly wiped out retail speculators in 2022.

While the "Trump Trade" certainly has some legs, lower taxes, deregulation, and tariffs will not solve many companies' " sales " problems. But that is the beauty of speculation: rising prices increase speculation, which leads to higher prices.
However, retail investors aren't the only ones going "all in" on the Trump Trade. Professional investors sharply increased equity exposure for Trump 2.0, which posted the highest equity exposure level in 11 years.
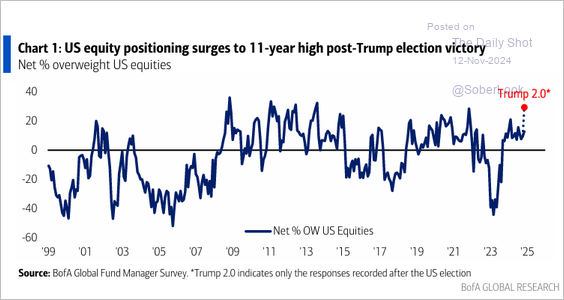
The market's reaction to the election and the potential for economic and business-friendly legislation is unsurprising. However, market analysts and economists may be extrapolating that optimism too much.
S&P 10,000
For example, this past week, Ed Yardeni (I will be writing a longer post on this soon) extrapolated the current market into 2030, providing a target of 10,000.
Wall Street is thrilled uncertainty surrounding the election is over, and the incoming administration has promised a grab bag of tax cuts while the economy shows strength after fresh interest rate cuts from the Federal Reserve. The veteran stock watcher Ed Yardeni expects the party to continue. Over the weekend, he raised his forecasts for the market benchmark, lifting his call to 10,000 for the close of the decade, at the end of 2029, from the 8000 he forecast on Oct. 18.
In the near term, his estimates call for the S&P 500 to end 2024 at 6100, reach 7000 in 2025, and 8000 in 2026. Yardeni expects the market to hit 10,000 in 2029, which will be the first year on the job for whoever succeeds Trump as president."
The chart shows the current bull market from the 2009 lows to the present, with a 12-month moving average and a trend channel extension into 2030. While Yardeni's forecast seems astonishing, it represents a bit more than a 7% annualized rate of return through the end of the decade.

Given that the past 15 years have produced returns roughly 50% higher than the long-term average, a 7% annualized rate of return may seem somewhat disappointing.
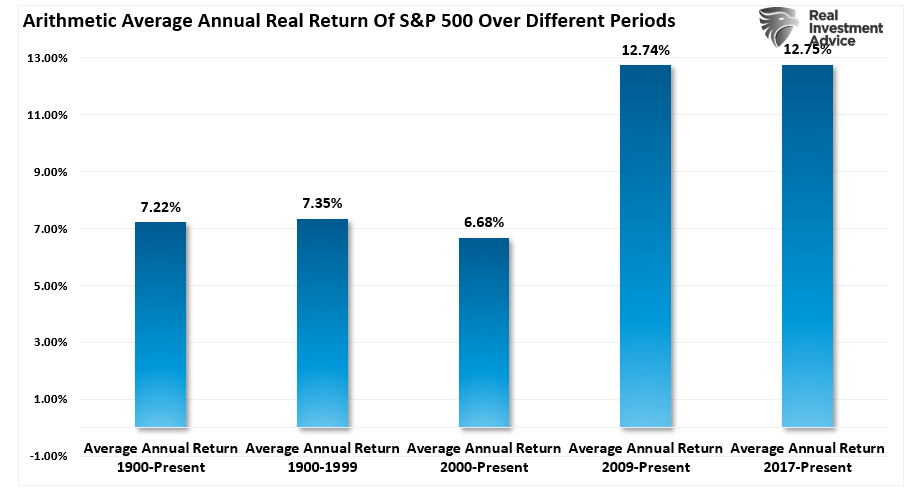
Furthermore, it is worth mentioning that even if Yardeni's prediction does come to fruition, investors should still expect to see volatility and sizeable drawdowns along the way. This will be the same as seen in the last 15 years when markets retested the 12-month moving average with fairly regular retracements on numerous occasions.

Concerning long-term market outlooks, it is helpful to remember that Wall Street analysts predicted the same in 1999 and 2007. At the time, valuations were elevated, but analysts and economists believed that economic growth would remain strong and support earnings growth well into the future. Unfortunately, despite the rather rosy outlook, economic realities overtook the exuberance, leading to significant market declines. The same assumptions existed in 1972 about the "Nifty Fifty," Also, let's not forget 1929 when Irving Fisher proclaimed the market had achieved a "permanently high plateau."

However, the key to whether Yardeni's projection comes to fruition hinges on economic and earnings growth.
Valuations & Earnings Growth Remain A Concern
I am not suggesting that the markets are about to enter a subsequent significant recessionary sell-off. However, I am suggesting some caution in assuming that Ed Yardeni's forecast of continued market returns is a statement of fact. Such is particularly the case given the current high valuation levels on both a forward and trailing earnings basis.

However, elevated 12-month operating and reported earnings valuations aren't the only factor; virtually all long-term valuation measures suggest some caution in long-term market return predictions. There are two ways to revert valuations: 1) the price remains stable while earnings rise, or 2) the price declines to revert valuations to earnings growth. Unfortunately, since 1871, over-valuations have never been resolved by prices remaining stable.

While the "Trump Trade" exuberance is currently elevated, given the backdrop for the "Trump Trade," risks must be considered. First, President Trump's market setup vastly differs from his first term in office in 2016, which implies higher risk into current forecasts.
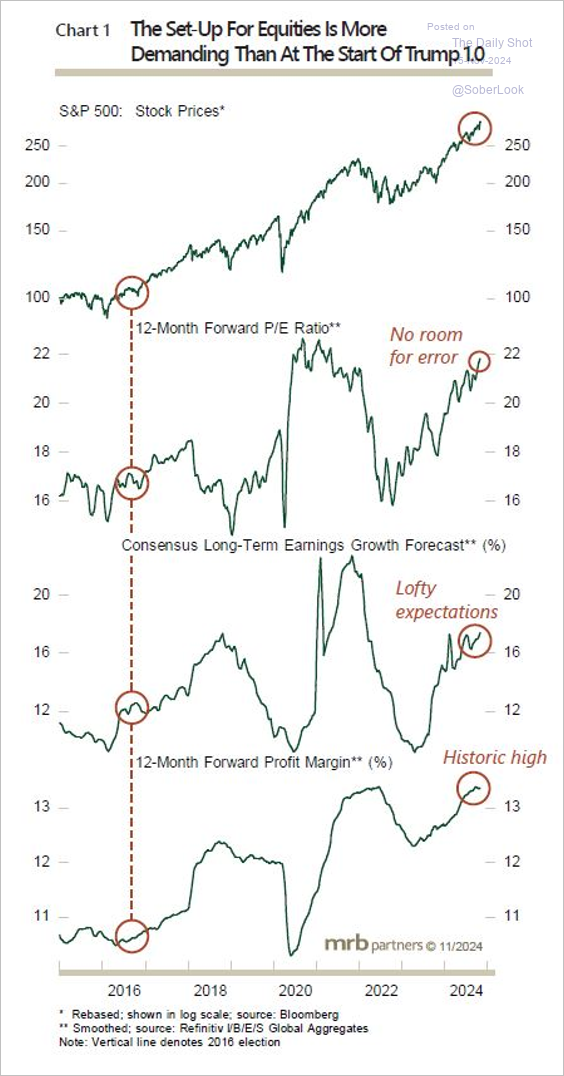
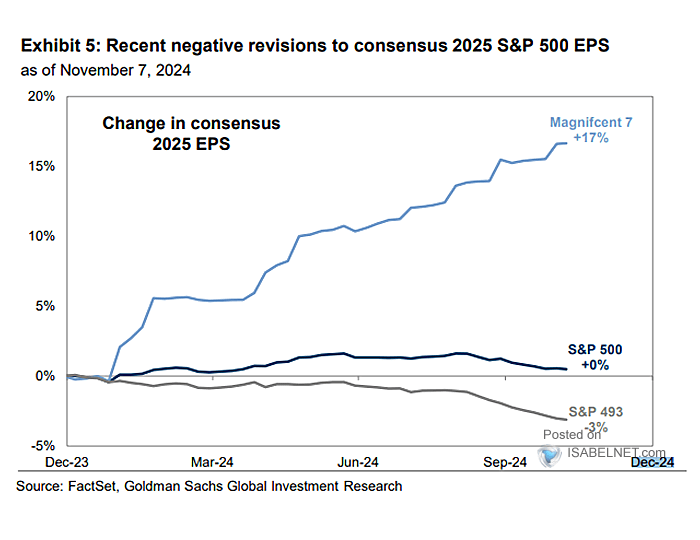
Second, earnings growth remains concerning. Despite a surging bull market in equities, the market's price reflects underlying earnings growth over time. As noted, valuations are currently elevated, but investors are always willing to pay for future earnings growth as long as it comes to fruition. In other words, the future "E" in the P/E ratio justifies the current price. However, the problem is that earnings growth only comes from seven companies effectively. While the hope is that the earnings for the bottom 493 companies will start to grow, they haven't over the past two years despite trillions in fiscal stimulus and strong economic growth rates.
Lastly, as noted by my colleague Albert Edwards from Societe Generale this week:
"Companies have been able to push through profit‑margin‑expanding price increases under the cover of two key events, namely 1) supply constraints in the aftermath of the Covid pandemic and 2) commodity cost-push pressures after Russia’s invasion of Ukraine. But we still emphasise that one of the main sources of the recent surge in profit margins is massive fiscal expansion. In short, the government has been spending more to the benefit of corporates."
As he notes, U.S. corporate profits are incredibly elevated as a percentage of GDP. Such levels are well outside historical norms, and without continued, outsized fiscal deficit increases, the reversion risk seems quite large.

However, it has not just been the post-pandemic surge in government spending, rising earnings, and profits. Over the last 15 years, the Government and Federal Reserve have delved into massive, unprecedented endeavors to support the economic and financial systems. From HAMP to HARP, TARP to QE, and zero interest rates were all used to support economic growth, translating into earnings growth for the S&P 500. Since 2009, there has been roughly $40 Trillion in various spending programs, generating just $6.5 Trillion in economic growth. (That isn't an excellent investment.)
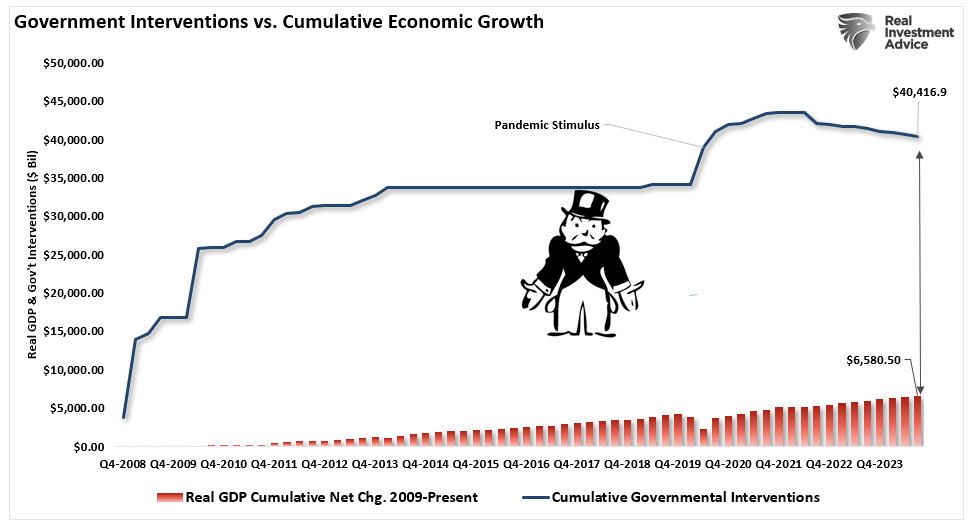
Here is the risk. President-elect Donald Trump has articulated plans to reduce the federal debt and deficit and streamline government operations. A key initiative in this regard is the establishment of the Department of Government Efficiency (DOGE), led by Elon Musk and Vivek Ramaswamy. The DOGE is tasked with identifying and eliminating wasteful spending and bureaucratic inefficiencies. Musk has expressed a goal of trimming $2 trillion from the annual federal budget, which stood at $6.7 trillion in the last fiscal year.
While the feasibility of such ambitious goals will likely prove difficult, even achieving one-quarter of that goal will negatively impact economic growth rates and corporate profitability. As is always the case, there is always a "cause and effect" of actions placed on the economy. Contracting spending, reducing Government employment, and reducing the deficit, all of which will provide long-term benefits, can likely not be executed without some short-term pain.
Therefore, as we head into 2025, it is okay to remain bullish on the "Trump Trade," just remain vigilant to changing economic conditions that could negatively impact expected earnings growth.
The "E" remains a critical factor in investors' "valuation" story.
How We Are Trading It
As noted last week, the stock market reflects both challenges and opportunities. Instead of focusing on worst-case scenarios, take constructive actions:
- Build a diversified portfolio and adjust based on evidence, not fear.
- Keep perspective,
- Focus on your financial goals and;
- Communicate with your financial advisor to remain steady amid uncertainty.
With the election behind us and the S&P 500 now in a seasonally strong period, bolstered by the weekly MACD buy signal, investors may want to consider several strategies:
- Use Stop-Loss Orders: To manage downside risk, consider using stop-loss orders.
- Increase Equity Exposure: Large-cap stocks historically perform well during this period. You could consider increasing exposure to diversified index funds or sector ETFs that align with historical trends.
- Review Portfolio Risk: While the MACD buy signal is a positive indicator, you should assess your portfolio’s risk tolerance and ensure it aligns with your long-term goals.
- Rebalance Allocations: Now may be a good time to rebalance by reducing positions in riskier assets or diversifying across asset classes.
If you are underweight equities, consider minor pullbacks and consolidations to add exposure as needed to bring portfolios to target weights. Pullbacks will likely be shallow, but being ready to deploy capital will be beneficial. Once we pass the inauguration, we can assess what policies will likely be enacted and adjust portfolios accordingly.
While there is no reason to be bearish, this does not mean you should abandon risk management.
Feel free to reach out if you want to navigate these uncertain waters with expert guidance. Our team specializes in helping clients make informed decisions in today's volatile markets.

Have a great week.
Research Report

Subscribe To "Before The Bell" For Daily Trading Updates
We have set up a separate channel JUST for our short daily market updates. Please subscribe to THIS CHANNEL to receive daily notifications before the market opens.
Click Here And Then Click The SUBSCRIBE Button
Subscribe To Our YouTube Channel To Get Notified Of All Our Videos
Bull Bear Report Market Statistics & Screens

SimpleVisor Top & Bottom Performers By Sector

S&P 500 Weekly Tear Sheet
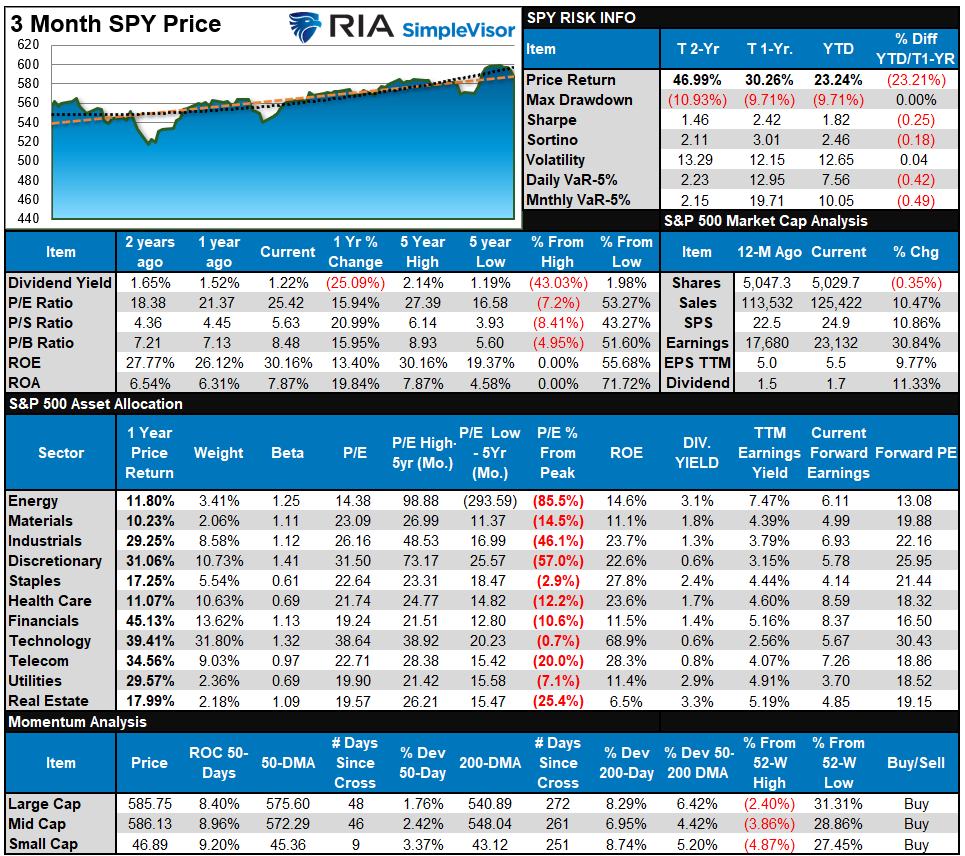
Relative Performance Analysis
Last week, we noted that the "re-risking" rally led to a massive market surge, and with the market's short-term overbought, a bit of a hiatus is likely over the next week or two as we head into Thanksgiving. That is precisely what occurred this past week, and with most markets and sectors not oversold yet, we could have some more sloppy trading next week. Continue to take profits and rebalancing positions as needed, but maintain exposure heading into year-end.

Technical Composite
The technical overbought/sold gauge comprises several price indicators (R.S.I., Williams %R, etc.), measured using "weekly" closing price data. Readings above "80" are considered overbought, and below "20" are oversold. The market peaks when those readings are 80 or above, suggesting prudent profit-taking and risk management. The best buying opportunities exist when those readings are 20 or below.
The current reading is 77.44 out of a possible 100.

Portfolio Positioning "Fear / Greed" Gauge
The "Fear/Greed" gauge is how individual and professional investors are "positioning" themselves in the market based on their equity exposure. From a contrarian position, the higher the allocation to equities, the more likely the market is closer to a correction than not. The gauge uses weekly closing data.
NOTE: The Fear/Greed Index measures risk from 0 to 100. It is a rarity that it reaches levels above 90. The current reading is 81.33 out of a possible 100.

Relative Sector Analysis

Most Oversold Sector Analysis

Sector Model Analysis & Risk Ranges
How To Read This Table
- The table compares the relative performance of each sector and market to the S&P 500 index.
- "MA XVER" (Moving Average Crossover) is determined by the short-term weekly moving average crossing positively or negatively with the long-term weekly moving average.
- The risk range is a function of the month-end closing price and the "beta" of the sector or market. (Ranges reset on the 1st of each month)
- The table shows the price deviation above and below the weekly moving averages.
Last week, the risk range analysis suggested that while the market remains bullish and exposure should be maintained, taking profits and rebalancing risks was advised. The correction this past week finally reversed the extreme overbought conditions in Gold and Gold Miners, providing a better entry point for investors. Healthcare is also very oversold, so a reflexive rally in those shares is likely heading into year-end. Despite the correction this past week, many sectors and the dollar are still trading at elevated levels. Such suggests we could see some additional sloppy trading this next week heading into the Thanksgiving holiday-shortened trading week after that.

Weekly SimpleVisor Stock Screens
We provide three stock screens each week from SimpleVisor.
This week, we are searching for the Top 20:
- Relative Strength Stocks
- Momentum Stocks
- Fundamental & Technical Strength W/ Dividends
(Click Images To Enlarge)
RSI Screen

Momentum Screen

Fundamental & Technical Screen

SimpleVisor Portfolio Changes
We post all of our portfolio changes as they occur at SimpleVisor:
Nov 12th
Trade Alert – Equity Model
This morning, we bought ABBV back up to its model weight. The stock was hit by over 12% yesterday, which, in our opinion, was a lot given the news on the Phase 2 trial termination of a Schizophrenia drug. Conversely, Walmart has become very expensive and is heading into earnings next week. The stock is up 60% YTD and extremely technically overbought. We are reducing it by about half a percent. Following the reduction, we are still decently overweight the position versus the S&P 500.
Equity Model
- Reduce Walmart (WMT) to 1.75% of the portfolio.
- Increase Abbvie (ABBV) back to the target weight of 5%.
Lance Roberts, C.I.O., RIA Advisors
Have a great week!
The post “Trump Trade” Sends Investors Into Overdrive appeared first on RIA.
Tags: Featured,newsletter
