Monday , November 18 2024
Home / Joaquin Monfort

Joaquin Monfort


Articles by Joaquin Monfort

USD/CHF Price Forecast: Reaches overbought levels

3 days ago

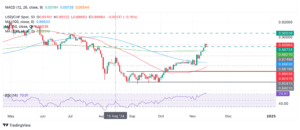
USD/CHF is in a strong uptrend which keeps making higher highs. 
However it has reached overbought levels according to the RSI momentum indicator 
This means bulls should be aware of the increased risk of pullbacks. 
USD/CHF continues rising in its established uptrend but it has now reached overbought levels (above 70) according to the Relative Strength Index (RSI) momentum indicator. When this occurs it advises long-holders not to add to their positions because of the increased risk of a pullback developing.

USD/CHF Daily Chart 

According to technical analysis theory “the trend is your friend” which means it is better to trade in the direction of the dominant trend. As such, the odds favor more upside for USD/CHF. The RSI could continue

Read More »

EUR/CHF Price Forecast: Attempting a bearish breakout from a Triangle pattern

6 days ago

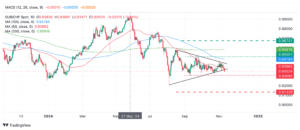
EUR/CHF is trying to break out of a Triangle pattern. 
If it succeeds it will probably lead to further downside towards the price objective for the pattern.
EUR/CHF is attempting to break out of a Triangle pattern it has formed over the last three months (see chart below).

EUR/CHF Daily Chart

A bearish close on Tuesday will indicate a decisive breakout has happened and suggest the start of a likely strong decline. 

The market activity prior to the formation of the Triangle (Since May 27) further tips the odds in favor of a downside evolution. 

If EUR/CHF breaks below the 0.9307 level (September 11 lows) it will further confirm an authentic bearish breakout, with the next target to the downside at 0.9132, the 61.8% Fibonacci extrapolation

Read More »

USD/CHF Price Prediction: Potential Bull Flag pattern forming

11 days ago

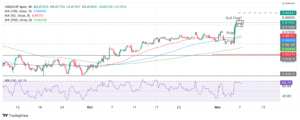
USD/CHF might be developing a Bull Flag continuation pattern. 
This suggests there will be an extension of the uptrend to upside targets higher. 
USD/CHF – which looked as if it might be reversing trend and starting a new short-term downtrend at the start of the week – suddenly turned on a dime and spiked higher on Wednesday. 

The pair rallied to a higher high, giving the established uptrend a shot in the arm. USD/CHF has since peaked and started to go sideways, forming what looks like a potential Bull Flag continuation price pattern.

USD/CHF 4-hour Chart 

If it is indeed a Bull Flag pattern it indicates more upside is on the cards for USD/CHF. 

A break above the flag’s high of 0.8775 would probably result in a continuation higher to a

Read More »

USD/CHF Price Prediction: Consolidates within short-term uptrend

October 16, 2024

USD/CHF is trading in a mini-range after pulling back from new highs. 
This is probably a pause before the pair goes to new highs. 
USD/CHF is consolidating within its short-term uptrend in what is likely to be a temporary pull back before the market goes higher again.

The pair is probably in a short-term uptrend now given the rising sequence of peaks and troughs since it broke out of the range-bound consolidation in August and September. 

USD/CHF 4-hour Chart 

USD/CHF will probably reach the target generated after it broke out of the range, at 0.8680, the 100% Fibonacci (Fib) extrapolation of the height of the range higher. A break above 0.8641 (October 14 high) would provide confirmation. A break above that level could lead to a

Read More »

USD/CHF Price Prediction: Pull back unfolding after higher high

October 15, 2024

USD/CHF is correcting back after peaking as it extends its uptrend. 
The pair will probably resume its bullish bias after the pull back has completed. 
USD/CHF is pulling back within its short-term uptrend after peaking at 0.8642 on Monday. The move is only likely to be a temporary correction, however, before the pair resumes its uptrend and extends its sequence of higher highs and higher lows. 

USD/CHF 4-hour Chart 

USD/CHF will probably reach the target generated after it broke out of the range, at 0.8680, the 100% Fibonacci (Fib) extrapolation of the height of the range higher. It has already met the conservative target at 0.8627, the 61.8% Fib level.

The Relative Strength Index (RSI) has exited the overbought region giving traders a

Read More »

USD/CHF Price Prediction: Now probably in a short and medium term bull trend

October 14, 2024

USD/CHF continues rising and might have established a medium-term uptrend. 
It is likely to continue higher although it is potentially overbought and a downside gap risks closing. 
USD/CHF is rising up and forming a sequence of higher highs and higher lows which indicates it is probably in both a short and – now also – a medium term uptrend. Given it is a key tenet of technical analysis that “the trend is your friend” the odds favor more upside to come. 

USD/CHF 4-hour Chart 

USD/CHF could continue rising until it reaches the next target to the upside which was generated when it broke out of the range. This target lies at 0.8680, the 100% Fibonacci (Fib) extrapolation of the height of the range higher. It has already met the conservative

Read More »

USD/CHF Price Prediction: Up leg almost reaches target and range high

October 2, 2024

USD/CHF is rising within a range-bound market. 
It has almost reached its target close to the top of the range high. 
USD/CHF extends its gains as it unfolds an up leg within a range-bound market. 

The move is underway and likely to reach the 0.8517 resistance level formed by multiple recent highs. A really bullish move could even see the pair reach the 0.8539 ceiling of the range.

USD/CHF 4-hour Chart 

USD/CHF is in a sideways trend. Given the principle in technical analysis that “the trend is your friend” the odds favor an extension of this trend. Once the pair reaches its upside target it will probably roll over and begin a down leg towards the range lows. 

Only a decisive break above 0.8539 and the top of the range would signal a

Read More »

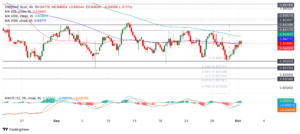
USD/CHF Price Prediction: Rising up within range-bound consolidation

October 1, 2024

USD/CHF is rising within a range-bound market. 
It has encountered resistance at a cluster of MAs but will probably continue higher.
USD/CHF is rising up within its sideways range. It has reached a cluster of major Moving Averages which are providing firm resistance. 

USD/CHF 4-hour Chart 

The trend is neither up nor down but rather sideways and so the oscillating character of the market is likely to extend, given the principle that “the trend is your friend.”

The blue Moving Average Convergence Divergence (MACD) momentum indicator line recently crossed above the red signal line, providing a buy signal. MACD is a more reliable indicator within sideways markets. 

USD/CHF will probably continue higher. A break above the 0.8480 high would

Read More »

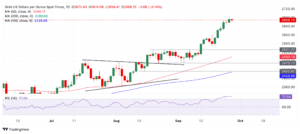
Gold recovers after US inflation data misses expectations

September 27, 2024

Gold rebounds at the end of the week after the release of US PCE inflation data comes out lower than expected. 
The data suggests a continuation of the Fed’s monetary easing stance which is a positive factor for Gold. 
Gold price retreats as less dovish interest rate prospects and a stronger US Dollar are bearish. 
Gold (XAU/USD) recovers to trade in the $2.660s per troy ounce on Friday after the release of US PCE inflation data fails to meet expectations. The disinflationary trend suggests the Federal Reserve (Fed) will continue to cut interest rates at a steady pace which is positive for Gold as a non-interest paying asset. 

US Core Personal Consumption Expenditures (PCE) showed a 0.1% rise MoM in August, falling short of the 0.2%

Read More »

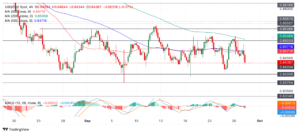
USD/CHF Price Prediction: Unfolding down leg within range

September 27, 2024

USD/CHF is trading lower within a range formed since August. 
It is in a sideways trend and a decisive breakout would be required to give directionality. 
USD/CHF continues trading up and down within a range. It is probably in a sideways trend, which given the principle that “the trend is your friend” is likely to endure.

USD/CHF 4-hour Chart 


USD/CHF is currently moving down within the range and it will probably reach at least as far as the 0.8415, the September 25 lows. A particularly bearish move might even fall to the 0.8400 floor. After that it will probably recover and continue the sideways trend. 

The Moving Average Convergence Divergence (MACD) momentum indicator is below the signal and the zero lines indicating bearishness. 

A

Read More »

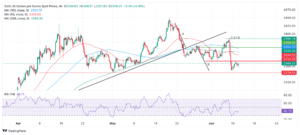
Gold continues bearish tone on outlook for US interest rates

June 11, 2024

Gold rolls over after retesting key resistance as the outlook for US interest rates remains elevated. 
This keeps the opportunity cost of holding non-yielding Gold high, making it less attractive to investors. 
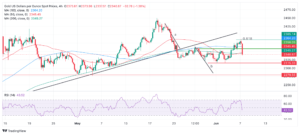
Gold (XAU/USD) trades a quarter of a percent lower on Tuesday after being rejected by key support-turned-resistance at $2,315 late Monday.
Higher interest-rate expectations in the US are weighing on the precious metal. The release of better-than-expected US jobs data on Friday suggested continued inflationary pressures. This, in turn, makes it less likely the US Federal Reserve (Fed) will lower interest rates in September, and the maintenance of higher interest rates increases the opportunity cost of holding non-yielding Gold, making it less attractive to

Read More »

Gold extends decline after US Nonfarm Payrolls beats expectations

June 7, 2024

Gold price declines after the release of US Nonfarm Payrolls data for May, shows a higher-than-expected change in employment and wages.
Gold was already trending lower after data unveiling PBoC reserves showed no change in May compared to April. 
Short-term technical picture remains volatile as Gold whipsaws higher and then lower. 
Gold (XAU/USD) falls all the way back to the $2,310s on Friday after the release of US Nonfarm Payrolls (NFP) data shows the US economy added 272K jobs in May when 185K had been expected. The result was also higher than the April figure which was revised down to 165K.

The US Bureau of Statistics (BLS) report showed a rise in Average Hourly Earnings of 4.1% YoY from a revised-up 4.0% in April, and beat estimates

Read More »

Swiss Franc at risk as inflation diverges from SNB forecasts

March 16, 2024

Swiss Franc is vulnerable as inflation data continues to undershoot official forecasts. 
The SNB expected inflation to average 1.9% in 2024 in its December forecast, but it currently sits at 1.2%. 
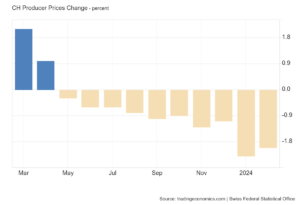
The latest Producer and Import Prices showed the tenth month of deflation in a row. 
The Swiss Franc (CHF) trades flat at the end of the trading week – off by barely a few hundredths of a percent in its most traded pairs. The overal fundamental outlook is not particulay favourable for CHF given Swiss inflation continues to decline and diverge from official estimates. This suggests the Swiss National Bank may need to ease policy, a generally negative factor for the currency as it attracts lower inflows of foreign capital. 

In its latest

Read More »

EUR/CHF Price Analysis: Pullback possible amid mixed signals

March 12, 2024

EUR/CHF touches 50-week SMA and recoils
RSI on daily chart indicates possibility of a pullback. 
Symmetrical Triangle has formed on 4-hour chart with breakout likely. 
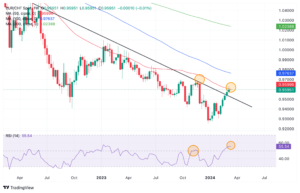
EUR/CHF has rebounded from the 0.9254 December 2023 lows and rallied up to resistance from a key barrier in the form of the 50-week Simple Moving Average (SMA). The pair is probably still in a long-term downtrend despite recent strength.

Euro to Swiss Franc: Weekly chart
The price has respected the red 50-week SMA on the multiple prior occasions it touched it during its downtrend. This reinforces the level’s strength as a resistance point. It probably indicates the price is about to pullback. There is a good chance it could correct back to the level of the trendline at around 0.9500 for a retest.

Read More »

Swiss Franc extends losses on Swiss interest rate outlook

March 6, 2024

The Swiss Franc edges lower against the US Dollar on the back of relatively low inflation in Switzerland, which indicates interest rates remaining low. 
SNB’s Jordan says Swiss Franc rising in real terms is hurting Swiss exporters, SNB unlikely to pursue CHF-strengthening policies. 
USD/CHF hits resistance at falling trendline, 50-week SMA. 
The Swiss Franc (CHF) edges lower against the US Dollar (USD) on Wednesday as traders continue to bet on a less-inflationary outlook for Switzerland, supporting a relatively low interest rate policy and dampening foreign capital inflows.
Inflation figures from Switzerland’s Federal Statistics Office released on Monday showed prices rising 1.2% in February, down from the 1.3% increase in January. Whilst not as low as the 1.1%

Read More »