Marc Chandler
September 24, 2019
SNB & CHF
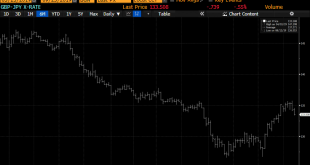
We have argued that the road to an orderly Brexit remains arduous and that sterling had entered an important technical area ($1.2500-$1.2530). At the same time, see the dollar as having approached the upper end of its broad trading range against the yen. One of the important drivers lifting the dollar was the dramatic rise in US yields. We thought that move is counter trend and that yields are headed lower again.
These views could be expressed in a short-sterling...
Read More »
Marc Chandler
June 12, 2019
SNB & CHF
US President Trump recently bemoaned the fact that the euro is undervalued. While his critics complain that he is prone to exaggeration, in this case, the euro is undervalued. This Great Graphic a 30-year chart of the euro has moved around its purchasing power parity as measured by the OECD. Currently, the euro is about 22% undervalued, and it has been cheap to PPP since for the past five years. The OECD’s model...
Read More »
Marc Chandler
December 4, 2018
SNB & CHF
To be sure, the Dollar Index is not the dollar. It is not even a trade-weighted measure of the dollar. Two of America’s largest trading partners, China and Mexico, are not represented. It is heavily weighted to the euro and currencies that move in its orbit, like the Swiss franc Swedish krona, and arguably the British pound.
It is primarily a speculative vehicle. Very few investors or businesses have exposure that...
Read More »
Marc Chandler
December 1, 2018
SNB & CHF
The softer than expected PCE deflator today plays into the dovish market mood. There may be little that can resist it until next Friday’s employment data, which should be another robust report with hourly earnings holding above 3% year-over-year. Last November, average hourly earnings rose by 0.3%. As this drops out of the year-over-year comparison, even a healthy bounce back from the 0.2% drop skewed by the hurricane...
Read More »
Marc Chandler
November 7, 2018
SNB & CHF
Broadly speaking, the risk is that the dollar’s cyclical advance is not complete. The drivers will likely remain in place through at least the middle of next year. Additional gradual interest rate hikes by the Federal Reserve and a favorable policy mix underpin the dollar. The Federal Reserve projects four rate hikes between now and the end of next year. Quarterly rate hikes through the middle of next year are the...
Read More »
Marc Chandler
October 17, 2018
SNB & CHF
The decline in the global equity market is the most serious since the February and March spill. In this Great Graphic, the white line is the S&P 500. With the setback, it is up a little more than 8% for the year. It managed to recover fully from the sell-off earlier in the year.
The fuchsia line is the MSCI World Index of developed countries. It is up 1.25% year-to-date, and it never managed to take out the high set...
Read More »
Marc Chandler
October 5, 2018
SNB & CHF
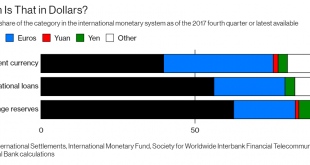
This Great Graphic comes from Peter Coy and team’s article in Business Week. It succinctly shows three metrics for the internationalization of domestic currencies: global payments, international bonds, and foreign exchange reserves. It does not strike me as surprising, and the role of the euro as a payments currency reflects its role in intra-European trade.
The substance of the article bears little relation to the...
Read More »
Marc Chandler
September 22, 2018
SNB & CHF
Boosted by tax reform, deregulation, and strong earnings growth, US equities have motored ahead, leaving other benchmarks far behind. As the Great Graphic here shows, most of the other benchmarks are lower on the year. The S&P 500 (yellow line) is up 8.8% for the year before the new record highs seeing seen now, while the Dow Jones Stoxx 600 from Europe (purple line) is still off 1.7%. The MSCI Asia Pacific Index...
Read More »
Marc Chandler
September 12, 2018
SNB & CHF
The CRB index has been trending lower since late May. It fell nearly 10% to retrace 50% of the rally come June 2017. This Great Graphic shows the 4 1/2 month trendline. It had been violated in late August but fell back under it at the end of last week.
On Monday, it gapped higher, above the trendline. Today it filled the gap and rallied to new session highs. A move above 192.00 would likely confirm a bottom of some...
Read More »
Marc Chandler
September 8, 2018
SNB & CHF
The euro recorded the low for the year so far on August 15 near $1.13. We had been anticipating a corrective phase for a couple days before the low was recorded. Recall that the previous Friday, August 10, all the major currencies, but the Japanese yen and Canadian dollar were beyond their Bollinger Bands.
The euro recovered toward $1.1735 on August 28, stopping shy of our initial objective of $1.1750. Yet through the...
Read More »
 Swiss Economicblogs.org