USD/CHF continues rising and might have established a medium-term uptrend. It is likely to continue higher although it is potentially overbought and a downside gap risks closing. USD/CHF is rising up and forming a sequence of higher highs and higher lows which indicates it is probably in both a short and – now also – a medium term uptrend. Given it is a key tenet of technical analysis that “the trend is your friend” the odds favor more upside to come. USD/CHF 4-hour Chart USD/CHF could continue rising until it reaches the next target to the upside which was generated when it broke out of the range. This target lies at 0.8680, the 100% Fibonacci (Fib) extrapolation of the height of the range higher. It has already met the conservative
Topics:
Joaquin Monfort considers the following as important: 1.) FXStreet on SNB&CHF, 1) SNB and CHF, Featured, newsletter
This could be interesting, too:
Nachrichten Ticker - www.finanzen.ch writes Die Performance der Kryptowährungen in KW 9: Das hat sich bei Bitcoin, Ether & Co. getan
Nachrichten Ticker - www.finanzen.ch writes Wer verbirgt sich hinter der Ethereum-Technologie?
Martin Hartmann writes Eine Analyse nach den Lehren von Milton Friedman
Marc Chandler writes March 2025 Monthly
- USD/CHF continues rising and might have established a medium-term uptrend.
- It is likely to continue higher although it is potentially overbought and a downside gap risks closing.
USD/CHF is rising up and forming a sequence of higher highs and higher lows which indicates it is probably in both a short and – now also – a medium term uptrend. Given it is a key tenet of technical analysis that “the trend is your friend” the odds favor more upside to come.
USD/CHF 4-hour Chart
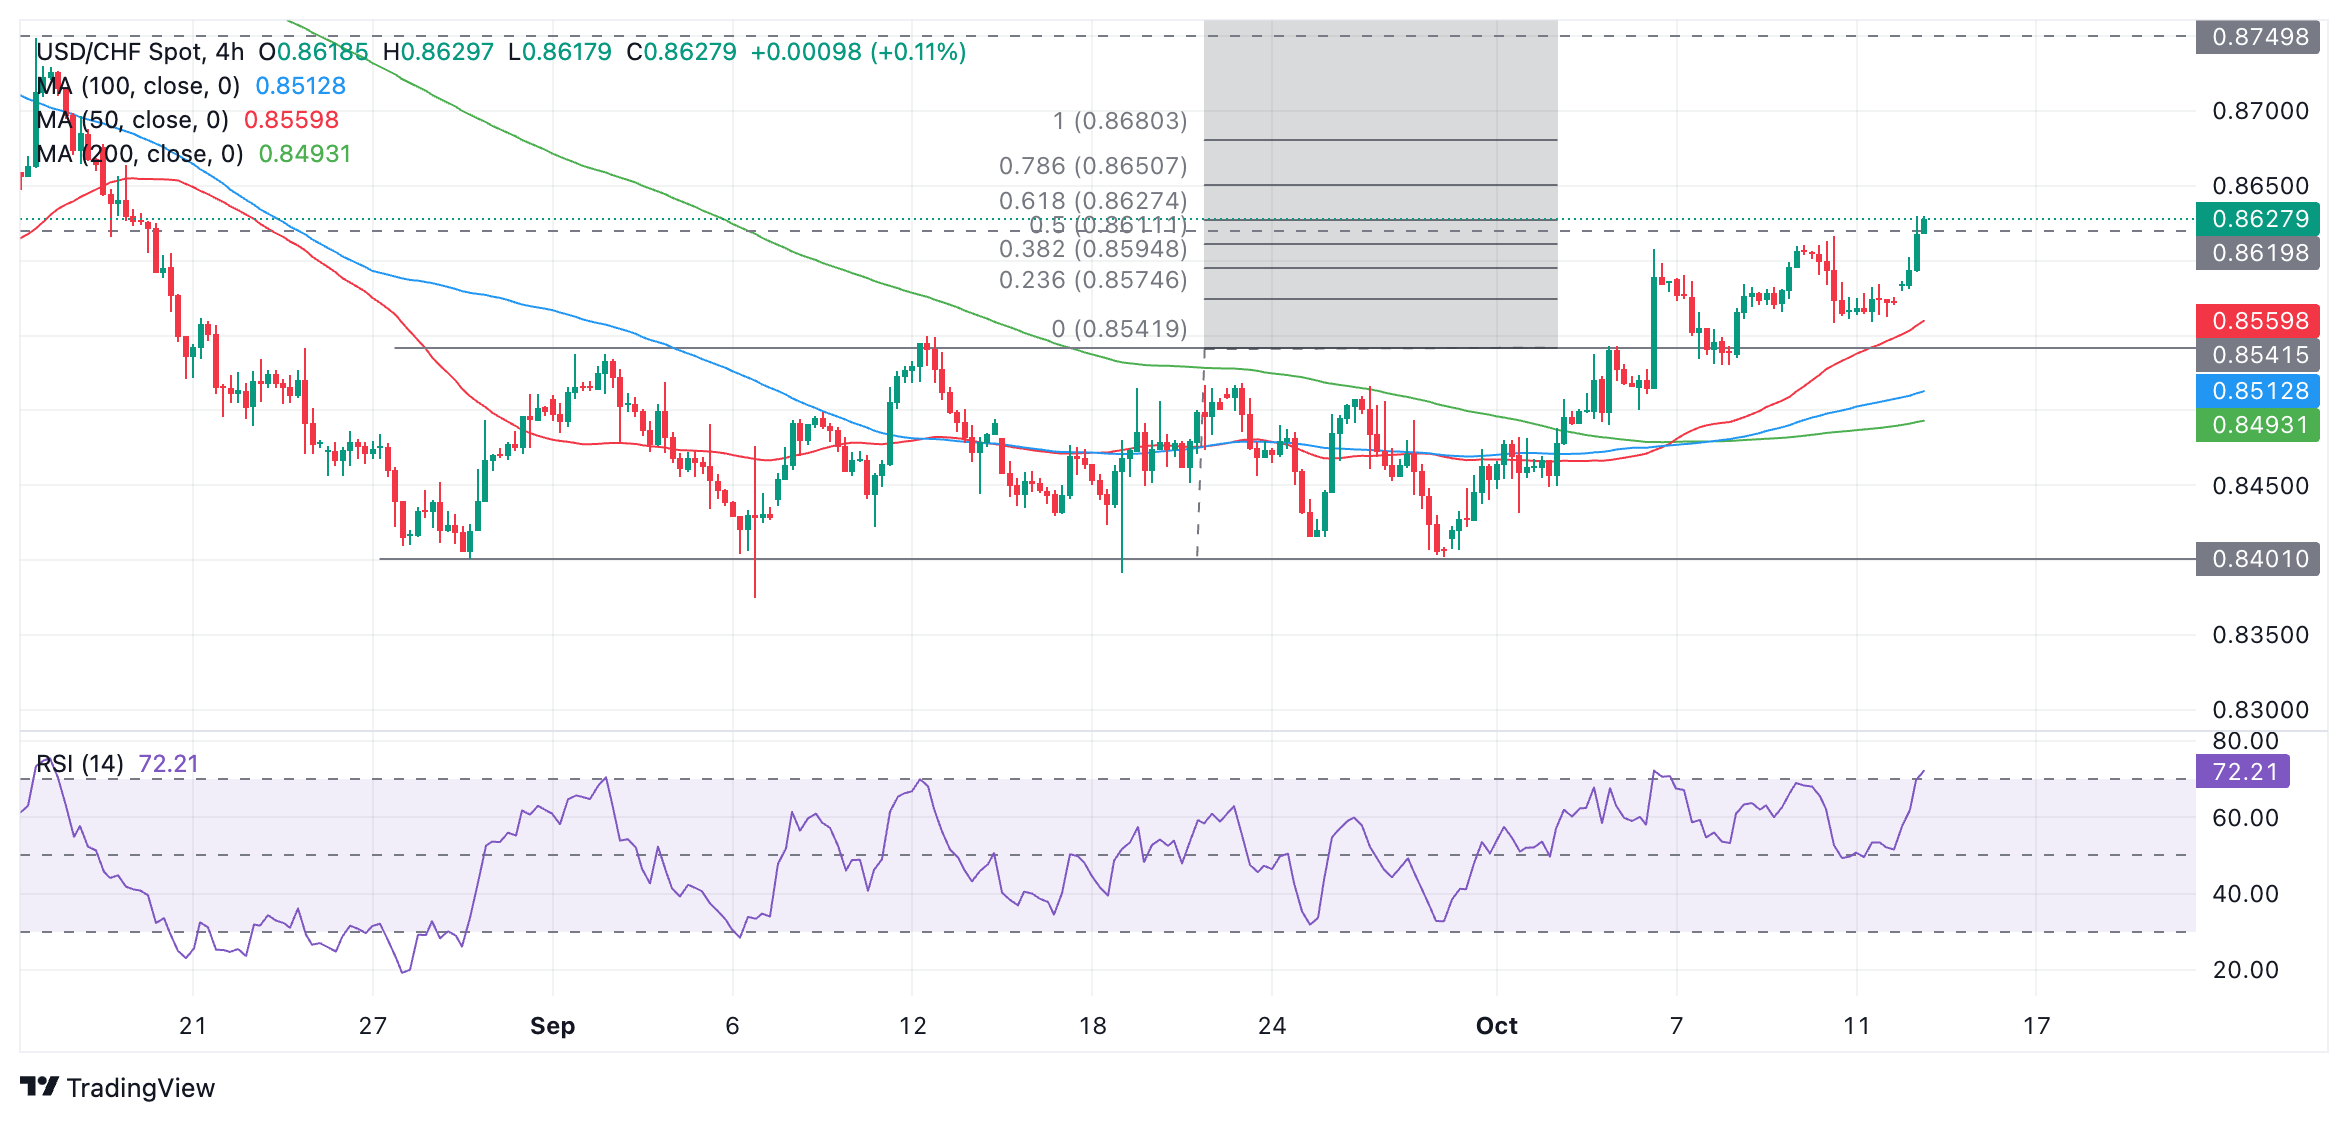
USD/CHF could continue rising until it reaches the next target to the upside which was generated when it broke out of the range. This target lies at 0.8680, the 100% Fibonacci (Fib) extrapolation of the height of the range higher. It has already met the conservative target at 0.8627, the 61.8% Fib level.
The Relative Strength Index (RSI) is in overbought territory and if it remains there on a closing basis it will advise traders not to add to their existing long positions.
A chart gap opened on Monday morning and there is a risk the market could pull back to fill this gap at some point.
Tags: Featured,newsletter