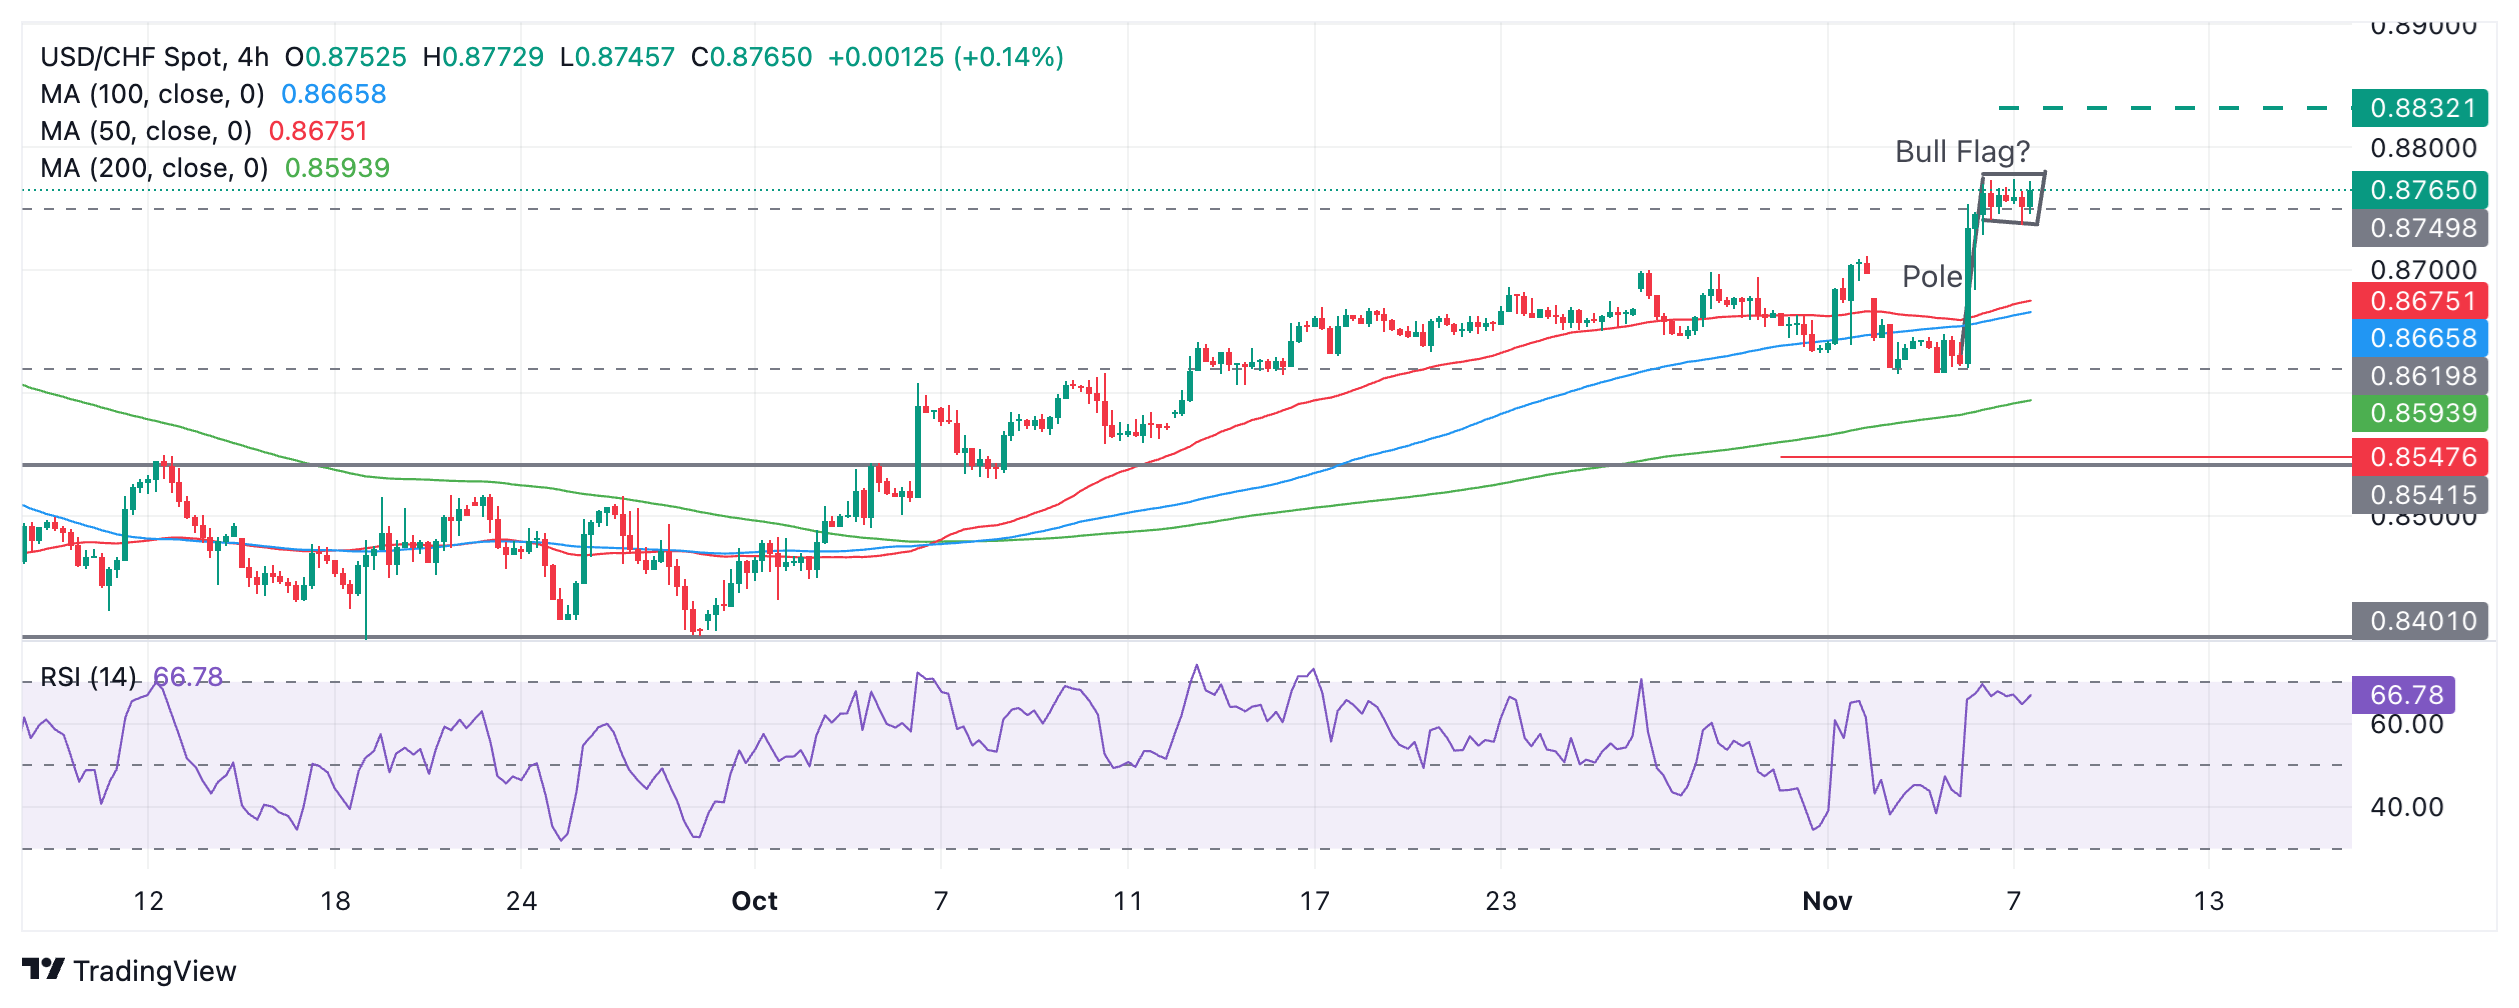
USD/CHF might be developing a Bull Flag continuation pattern. This suggests there will be an extension of the uptrend to upside targets higher. USD/CHF – which looked as if it might be reversing trend and starting a new short-term downtrend at the start of the week – suddenly turned on a dime and spiked higher on Wednesday. The pair rallied to a higher high, giving the established uptrend a shot in the arm. USD/CHF has since peaked and started to go sideways, forming what looks like a potential Bull Flag continuation price pattern. USD/CHF 4-hour Chart If it is indeed a Bull Flag pattern it indicates more upside is on the cards for USD/CHF. A break above the flag’s high of 0.8775 would probably result in a continuation higher to a
Topics:
Joaquin Monfort considers the following as important: 1.) FXStreet on SNB&CHF, 1) SNB and CHF, Featured, newsletter
This could be interesting, too:
Nachrichten Ticker - www.finanzen.ch writes Die Performance der Kryptowährungen in KW 9: Das hat sich bei Bitcoin, Ether & Co. getan
Nachrichten Ticker - www.finanzen.ch writes Wer verbirgt sich hinter der Ethereum-Technologie?
Martin Hartmann writes Eine Analyse nach den Lehren von Milton Friedman
Marc Chandler writes March 2025 Monthly
- USD/CHF might be developing a Bull Flag continuation pattern.
- This suggests there will be an extension of the uptrend to upside targets higher.
USD/CHF – which looked as if it might be reversing trend and starting a new short-term downtrend at the start of the week – suddenly turned on a dime and spiked higher on Wednesday.
The pair rallied to a higher high, giving the established uptrend a shot in the arm. USD/CHF has since peaked and started to go sideways, forming what looks like a potential Bull Flag continuation price pattern.
USD/CHF 4-hour Chart
If it is indeed a Bull Flag pattern it indicates more upside is on the cards for USD/CHF.
A break above the flag’s high of 0.8775 would probably result in a continuation higher to a target at 0.8832, the 61.8% Fibonacci extrapolation of the flagpole or “Pole” higher. The flagpole is the steep rally prior to the consolidation.
The Relative Strength Index (RSI) momentum indicator is not yet overbought but it is close. This suggests there is still more scope for upside before the uptrend becomes temporarily exhausted. If RSI enters the overbought zone it will be a signal for long-holders not to add to their positions.
Tags: Featured,newsletter

