USD/CHF trades successfully above 21-day SMA, 23.6% Fibonacci retracement. Positive oscillators favor further upside, 0.9832/37 can stop buyers beyond 50-day SMA. 0.9600 will gain the bear’s attention below the monthly bottom. USD/CHF takes the bids to 0.9740, following an intra-day high of 0.9744, amid the initial trading session on Wednesday. The pair recently crossed 21-day SMA and 23.6% Fibonacci retracement of its October 2019 to January 16, 2020 low. If the same is looked in conjunction with the price-positive oscillators like MACD and RSI, the current recovery is likely to extend. In doing so, January 10 top of 0.9763 and 38.2% Fibonacci retracement near 0.9771 can offer immediate resistance ahead of highlighting a 50-day SMA level of 0.9791. If at all
Topics:
Anil Panchal considers the following as important: 1) SNB and CHF, 1.) FXStreet on SNB&CHF, Featured, newsletter
This could be interesting, too:
Vibhu Vikramaditya writes Navigating the Slippery Slope: How Hoover’s Interventions Paved the Way for the Great Depression
Ryan McMaken writes Frédéric Bastiat Was a Radical Opponent of War and Militarism
Douglas French writes Millennials: In Costco We Trust
Joseph T. Salerno writes What Fed “Independence” Really Means
- USD/CHF trades successfully above 21-day SMA, 23.6% Fibonacci retracement.
- Positive oscillators favor further upside, 0.9832/37 can stop buyers beyond 50-day SMA.
- 0.9600 will gain the bear’s attention below the monthly bottom.
| USD/CHF takes the bids to 0.9740, following an intra-day high of 0.9744, amid the initial trading session on Wednesday. The pair recently crossed 21-day SMA and 23.6% Fibonacci retracement of its October 2019 to January 16, 2020 low. If the same is looked in conjunction with the price-positive oscillators like MACD and RSI, the current recovery is likely to extend.
In doing so, January 10 top of 0.9763 and 38.2% Fibonacci retracement near 0.9771 can offer immediate resistance ahead of highlighting a 50-day SMA level of 0.9791. If at all bulls remain interested beyond 0.9791, an area comprising October 2019 low and multiple tops marked during late-December 2019, around 0.9832/37 could return to the charts. Alternatively, pair’s declines below 23.6% Fibonacci retracement and 21-day SMA, respectively near 0.9710 and 0.9698, can push the bears towards 0.9660 and the monthly low of 0.9613. During the quote’s extended south-run past-0.9613, 0.9600 will be in focus. |
USD/CHF daily chart(see more posts on USD/CHF, )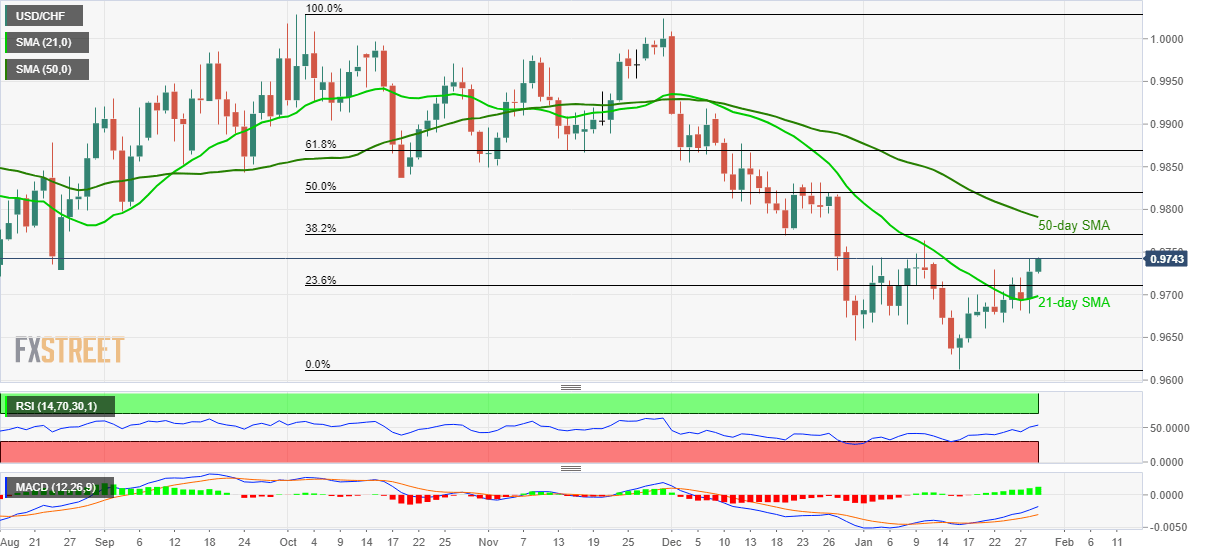 - Click to enlarge |
Trend: Recovery expected
Tags: Featured,newsletter