Friday , April 19 2024
Home / Anil Panchal

Anil Panchal


Articles by Anil Panchal

USD/CHF Price Analysis: Pressured below 100-HMA, short-term resistance line

April 13, 2020

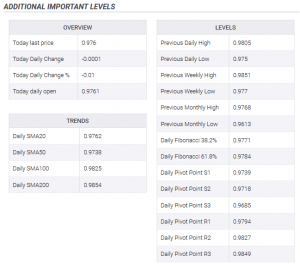
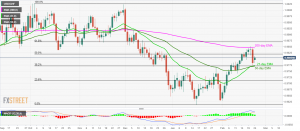
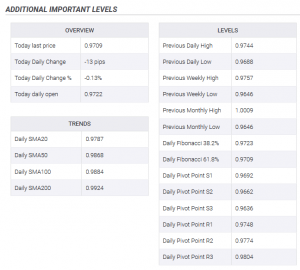
USD/CHF extends gradual declines from the monthly top marked the last-Monday.
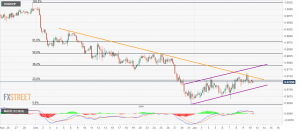
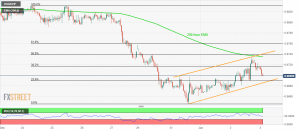
A descending trend line support, 61.8% Fibonacci retracement may offer intermediate rests during the downside.
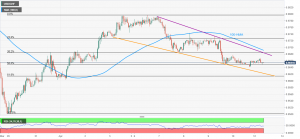
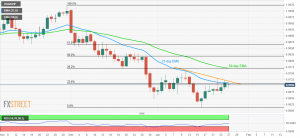
0.9745/50 can act as a buffer resistance beyond 100-HMA.
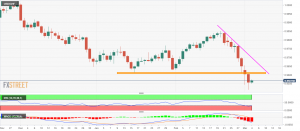
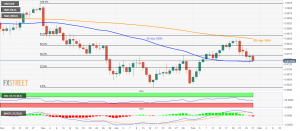
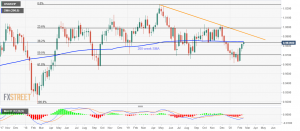
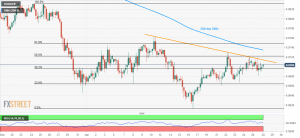
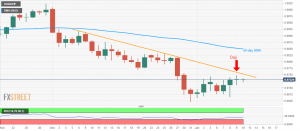
USD/CHF remains under pressure while taking rounds to 0.9655, down 0.05% on a daily, amid the early trading session on Monday.
The pair currently tests 50% Fibonacci retracement of its upside from March 27 to April 06. However, a descending trend line from last-Monday, at 0.9685, followed by a 100-HMA level of 0.9693, restricts the pair’s recovery moves.
Should there be a clear upside past-0.9693, the pair can cross 0.9700 mark to aim for 0.9745/50 area comprising multiple lows/highs marked during early-April.
Meanwhile, a

Read More »

USD/CHF Price Analysis: Follows rising channel on H4 ahead of SNB

March 19, 2020

USD/CHF stays positive near a three-week high.
The resistance line of an eight-day-old rising trend channel limits the immediate upside.
200-bar SMA offers immediate support, SNB in the spotlight.
USD/CHF pulls back from the resistance line of a short-term rising trend channel while taking rounds to 0.9695, up 0.16%, during the early Thursday.
In addition to the channel’s resistance, nearly overbought RSI conditions also challenge the pair’s further upside.
However, sellers will wait for the entry below 200-bar SMA level of 0.9650 while targeting 61.8% Fibonacci retracement level of February 20 to March 09 fall, at 0.9590.
During the pair’s additional weakness past-0.9590, the said channel’s support line near 0.9490 will be the key to watch.
On the upside, a

Read More »

USD/CHF Price Analysis: Pullback from 50-day EMA shifts focus to weekly support trendline

March 18, 2020

USD/CHF slips from a two-week high.
61.8% Fibonacci retracement, 200-day EMA add to the resistances.
While extending its U-turn from 50-day EMA, USD/CHF drops 0.30% to 0.9583 ahead of the European session on Wednesday.
The pair currently declines towards 38.2% Fibonacci retracement of its fall from November 2019, at 0.9500. However, an upward sloping trend line since March 09, near 0.9470 now, could restrict further downside.
In a case where the bears dominate past-0.9470, 0.9400 and 0.9320 will offer intermediate halts to the pair’s southward trajectory towards the monthly low around 0.9180.
Meanwhile, a daily closing beyond 50-day EMA level of 0.9650 needs to overcome 61.8% of Fibonacci retracement, close to 0.9700, ahead of confronting 200-day EMA figures

Read More »

USD/CHF Price Analysis: Below 100-bar SMA inside weekly rising channel

March 17, 2020

USD/CHF holds onto recovery gains inside the short-term bullish technical pattern.
Key SMA, sluggish MACD question the buyers.
In addition to the current risk-reset, USD/CHF takes clues from the technical indicators while rising 0.26% to 0.9493 amid the initial trading session on Tuesday.
The pair recently bounced off the support-line of a one-week-old rising trend channel, which in turn pushes the quote towards a 100-bar SMA level of 0.9540.
However, the quote’s further upside beyond 0.9540 might find it difficult to sustain as 61.8% Fibonacci retracement of the declines from early-February, at 0.9595, can question the buyers.
If at all the bulls manage to conquer 0.9600 round-figure, 200-bar SMA and the resistance line of the said channel around 0.9655 could

Read More »

USD/CHF Price Analysis: Extends run-up beyond 10-day SMA

March 13, 2020

USD/CHF holds onto recovery gains from 23.6% Fibonacci retracement level.
50% of Fibonacci retracement, January month low on the bulls’ radars.
Sellers can take entry below 0.9320.
USD/CHF adds 0.22% to its previous recovery, currently crossing 10-day SMA, while trading near 0.9460 during the early Friday. The pair manages to remain positive beyond 23.6% Fibonacci retracement of its fall from November 2019.
As a result, buyers can aim for further upside beyond a 38.2% Fibonacci retracement level of 0.9500.
In doing so, 50% of Fibonacci retracement and January month’s low, respectively near 0.9600 and 0.9615, can please the bulls.
During the pullback, 0.9320 can act as additional support below the 23.6% Fibonacci retracement level of 0.9378.
However, a daily

Read More »

USD/CHF Price Analysis: Bears will keep eyes on support trendline from 2015

March 9, 2020

USD/CHF remains on the back foot despite recovering off-late.
61.8% of Fibonacci retracement will be on the sellers’ radars.
Buyers are less likely to take the risk unless revisiting early-2020 levels.
USD/CHF registers 1.36% loss to 0.9260 while heading into the European open on Monday. The pair earlier dropped below the longer-term support line, stretched from May 2015, but fails to stay beneath the same off-late.
As a result, the bears will await a sustained fall below the 0.9260/55 support-zone to aim for 61.8% Fibonacci retracement of the 2015-16 upside, at 0.9115.
During the quote’s additional downside below 0.9115, May 2015 low near 0.9070 and 0.9000 will lure the bears.
On the upside, 50% Fibonacci retracement level of 0.9350 and September 2018 bottom

Read More »

USD/CHF Price Analysis: 0.9610/15 challenges recovery from multi-month low

March 4, 2020

USD/CHF bounces off 23-month low amid oversold RSI.
January/February bottoms could restrict immediate upside.
An eight-day-old falling trend line adds to the resistance.
February 2018 top seems to be on the Bears’ radar.
USD/CHF recovers 0.11% from the lowest since September 2018 amid the pre-Europe session on Wednesday. With the RSI conditions oversold, the quote seems to extend the pullback towards the lows marked during January and February months of the current year. However, it’s further is less likely considering bearish MACD.
If at all the buyers refrain to respect MACD and dominate past-0.9615 resistance, a short-term falling trend line from February 21, currently at 0.9700, will be important.
It should, however, be noted that the pair’s sustained

Read More »

USD/CHF Price Analysis: 17-week-old falling trendline, 61.8 percent Fibonacci on bears’ radar

March 2, 2020

USD/CHF remains on the back foot near the multi-week low.
Bearish MACD signals further downside, key support question the sellers.
200-week SMA acts as the key upside barrier.
Despite bouncing off September 2018 lows, USD/CHF stays 0.11% down while trading around 0.9640 during early Monday. Also portraying the pair’s weakness are bearish conditions of MACD.
That said, a downward sloping trend line since early October 2019, at 0.9600 now, acts as the immediate support.
Also challenging the sellers is 61.8% Fibonacci retracement of the pair’s rise from February 2018 to April 2019, at 0.9585.
In a case where the bears manage to conquer 0.9585 on a weekly closing basis, September 2018 bottom surrounding 0.9540 will return to the charts.
Alternatively, 50% of Fibonacci

Read More »

USD/CHF Price Analysis: 50-day SMA challenges further declines

February 27, 2020

USD/CHF trades near a three-week low.
Bearish MACD, failures to carry the latest recovery keep sellers hopeful, 50-day SMA acts as near-term key support.
200-day SMA, 61.8% Fibonacci retracement act as near-term key resistances.
USD/CHF remains on the back foot around 0.9740, down 0.25%, during the initial trading session on Thursday. That said, the quote fails to carry the previous day’s recovery gains.
Even so, a 50-day SMA level of 0.9737 acts as the near-term key support stopping the sellers despite bearish MACD.
Should prices provide a daily closing below 0.9737, 23.6% Fibonacci retracement of the pair’s declines from November 2019 to January 2020, at 0.9709, can flash on the chart.
Assuming the USD/CHF pair’s extended weakness below 0.9709, 0.9700

Read More »

USD/CHF registers four-day losing streak as coronavirus keeps risk-tone heavy

February 26, 2020

USD/CHF holds onto losses amid fears of coronavirus outbreak.
Soft coronavirus statistics from China fail to counter widespread disease data from the rest of the globe.
China’s ability to meet phase-one deal terms seem to gain a little appreciation among traders.
The US New Home Sales, Swiss ZEW Survey can offer intermediate moves.
USD/CHF flashes 0.03% loss while trading around 0.9760 during early Wednesday. In doing so, the quote declines for the fourth day in a row and the reason could be traced from the coronavirus (COVID-19) outbreak.
The Chinese disease is now present in the key European economies while also tightening its grip in the rest of Asia. The latest numbers suggest that the total number of confirmed coronavirus cases in Italy has increased to 323

Read More »

USD/CHF Price Analysis: Bearish spinning top keeps sellers hopeful

February 25, 2020

USD/CHF snaps two-day losing streak.
Bearish candlestick formation, sustained trading below 200-day SMA favor further selling.
Bullish MACD, 50-day SMA question the bears.
USD/CHF registers fewer moves while trading around 0.9790 during the pre-European session on Tuesday. The daily chart forms a bearish candlestick pattern but bullish MACD and 50-day SMA could limit further declines.
That said, the bears will be more powerful to aim for 0.9700 if breaking a 50-day SMA level of 0.9740 on a daily closing basis.
During the quote’s further declines below 0.9700, the month-start top near 0.9670 and the January month bottom surrounding 0.9612 can offer intermediate halts to 0.9600 round-figure.
Alternatively, the pair’s rise beyond Monday’s top of 0.9816 negates the

Read More »

USD/CHF Price Analysis: 200-day EMA questions pullback from 0.9770/75 support confluence

February 24, 2020

USD/CHF bounces off the short-term key support confluence comprising 21 and 50-day EMA as well as 38.2% Fibonacci retracement.
200-day EMA, 61.8% Fibonacci challenge buyers amid bullish MACD.
USD/CHF registers 0.21% gains while taking the bids around 0.9805 during the early Monday. The pair recently reversed from 21/50-day EMA and 38.2% Fibonacci retracement of October 2019 to January 2020 declines. Also supporting the pullback are bullish signals from MACD.
That said, the pair now aims to confront 50% Fibonacci retracement level of 0.9820 whereas a 200-day EMA level of 0.9845 becomes the tough nut to crack for buyers afterward.
Should there be a sustained run-up beyond 0.9845, 61.8% Fibonacci retracement level of 0.9870 and 0.9900 will be on the bulls’ radars.

Read More »

USD/CHF Price Analysis: Bulls aim for 200-week SMA as MACD turns strongest in nine weeks

February 19, 2020

USD/CHF registers three-week winning streak, breaks above 38.2% Fibonacci retracement for the first time in a year.
61.8% Fibonacci retracement, September 2018 low act as the key supports.
USD/CHF takes the bids to 0.9835 amid the pre-European session on Wednesday. In doing so, the pair crosses 38.2% Fibonacci retracement of its broad run-up between February 2018 and April 2019. Also supporting the pair’s upside is a first in nine weeks bullish MACD signal.
Based on that, buyers are again targeting a 200-week SMA level of 0.9850 whereas a descending trend line from April 2019, at 0.9940 can question the bulls afterward.
In a case where the USD/CHF prices stay strong beyond 0.9940, chances of witnessing the 1.0000 mark on the chart can’t be ruled out.

Read More »

USD/CHF Price Analysis: Sellers catch a breath around 61.8% Fibonacci

February 13, 2020

USD/CHF stalls the previous day’s declines after breaking the weekly support line (now resistance).
Late-December lows limit immediate upside, 50% Fibonacci can check the declines.
Bearish MACD favors further weakness in the quote.
USD/CHF clings to 0.9755 during the pre-European session on Wednesday. The pair snapped six-day winning streak on the break of an ascending trendline since February 03. However, 61.8% Fibonacci retracement of December 24-January 16 fall restricts the pair’s immediate declines.
Also increasing the odds for the pair’s further downside below the key        0.9750 support are bearish MACD signals, which in turn could drag the quote to January 22 high near 0.9730.
During the pair’s further weakness past-0.9730, 50% of Fibonacci retracement

Read More »

USD/CHF Price Analysis: Multiple upside barriers to check bulls amid overbought RSI

February 6, 2020

USD/CHF registers four-day winning streak, nears one-week high.
A falling trend line since December 25, seven-week-old horizontal resistance limits the immediate upside.
Overbought RSI conditions increase the odds of a pullback.
USD/CHF remains mildly positive while gaining 0.07% to 0.9745 amid the pre-Europe session on Thursday. Overbought RSI conditions, coupled with multiple key resistance lines, question the pair’s further upside.
As a result, sellers will look for entry below 38.2% Fibonacci retracement of the pair’s declines from December 06, 2020, to January low, at 0.9730.
In doing so, an ascending trend line since Monday, at 0.9700, will be on their radars.
During the quote’s further weakness past-0.9700, 0.9630/25 will be the key support to watch.
On the

Read More »

USD/CHF Price Analysis: Registers three-day winning streak, probes 21-day EMA

February 5, 2020

USD/CHF extends recovery from mid-January lows.
A ten-week-old falling trend line, short-term horizontal resistance area will challenge the pair’s latest pullback.
The pair’s break of yearly low can push the bears towards late-2018 lows.
USD/CHF takes the bids to 0.9700 during the pre-European session on Wednesday. That said, 21-day EMA limits the pair’s immediate upside amid the bullish MACD signals.
Even if the pair manages to clear the 0.9700 mark on a daily closing basis, a downward sloping trend line since November 29, at 0.9740, will stand tall to question the buyers.
Additionally, 0.9770/63 area including December 12, 2019, low and highs marked from January could keep a tab on the bulls past-0.9740.
Meanwhile, the last week’s low near 0.9660 and the yearly

Read More »

USD/CHF Price Analysis: 21-day SMA limits immediate downside

January 31, 2020

USD/CHF confronts 23.6% Fibonacci retracement following the bounce off 21-day SMA.
Early month lows add to the support while 38.2% Fibonacci retracement, 50-day SMA will challenge recovery moves.
USD/CHF takes the bids to 0.9707 during the pre-Europe session on Friday. In doing so, the pair repeats the tendency of staying beyond 21-day SMA while also confronting 23.6% Fibonacci retracement of its declines from November 29, 2019, to January 16, 2020.
The sustained trading above short-term SMA is likely to extend the pair’s pullback moves toward a 38.2% Fibonacci retracement level of 0.9770, following the clear break of 0.9820 mark comprising 23.6% of Fibonacci retracement.
However, a 50-day SMA level near 0.9781 and late-December 2019 top surrounding 0.9830 will

Read More »

USD/CHF Price Analysis: Heavy inside two-week-old ascending channel

January 30, 2020

USD/CHF snaps two-day winning streak, reversed from monthly resistance line.
Buyers will remain hopeful unless the channel’s support breaks.
50% and 38.2% of Fibonacci retracements could offer intermediate halts during the declines.
USD/CHF declines to 0.9728, -0.11%, by the press time of early Thursday. The pair recently reversed from an ascending trend line since December 29, 2019. Even so, it stays inside the short-term bullish technical formation.
Considering the pair’s latest pullback form the key resistance, sellers can target 50% and 38.2% of Fibonacci retracements of the pair’s declines between December 24, 2019, and January 16, 2020, around 0.9720 and 0.9700 respectively.
However, the channel’s support line, at 0.9690, could restrict further declines, if

Read More »

USD/CHF Price Analysis: Flashes 13-day high, 50-day SMA on bulls’ radar

January 29, 2020

USD/CHF trades successfully above 21-day SMA, 23.6% Fibonacci retracement.
Positive oscillators favor further upside, 0.9832/37 can stop buyers beyond 50-day SMA.
0.9600 will gain the bear’s attention below the monthly bottom.
USD/CHF takes the bids to 0.9740, following an intra-day high of 0.9744, amid the initial trading session on Wednesday. The pair recently crossed 21-day SMA and 23.6% Fibonacci retracement of its October 2019 to January 16, 2020 low. If the same is looked in conjunction with the price-positive oscillators like MACD and RSI, the current recovery is likely to extend.
In doing so, January 10 top of 0.9763 and 38.2% Fibonacci retracement near 0.9771 can offer immediate resistance ahead of highlighting a 50-day SMA level of 0.9791.
If at all

Read More »

USD/CHF Price Analysis: Bears hold the baton despite recent recovery

January 28, 2020

USD/CHF stays beyond 23.6% Fibonacci retracement but fails to clear a fortnight-long falling trend line.
200-bar SMA, 61.8% Fibonacci retracement add to resistance.
USD/CHF pierces 0.9700 by the press time of early Tuesday. The pair have recently been recovering but a downward sloping trend line since January 16 caps immediate upside.
Even if the buyers cross 0.9715 resistance line, 200-bar SMA and 61.8% Fibonacci retracement of its December 24, 20119 to January 16, 2020 fall, near 0.9735 and 0.9750 respectively, could challenge the bulls.
In a case where the USD/CHF prices rally beyond 0.9750, January 10 top surrounding 0.9765 could challenge further upside.
Meanwhile, 23.6% Fibonacci retracement, at 0.9665, holds the key to pair’s declines towards the monthly

Read More »

USD/CHF Price Analysis: Weak below 21-day EMA, two-week-old falling trendline`

January 27, 2020

USD/CHF confronts near-term key resistances.
The previous week’s low can lure short-term sellers.
50-day EMA, 38.2% Fibonacci retracement confluence add to the resistance.
USD/CHF struggles to extend the latest recovery while trading around 0.9700 during Monday’s Asian session. 21-day EMA and 23.6% Fibonacci retracement of the pair’s declines from November 2019 to the current month low seem to restrict the immediate upside.
In addition to 0.9711 immediate resistance confluence, a downward sloping trend line since January 10, at 0.9720 now, also challenges short-term buyers.
Even if the pair manages to cross 0.9720 barriers, it’s rally isn’t confirmed as 50-day EMA and 38.2% Fibonacci retracement around 0.9770 stands tall to disappoint the bulls.
On the flip side,

Read More »

USD/CHF Price Analysis: MACD turns bearish for the first time in a week

January 23, 2020

USD/CHF extends recovery gains from the two-day low.
Sellers await a downside break of 23.6% Fibonacci retracement.
A monthly trend line will keep buyers away.
USD/CHF takes rounds to 0.9683 during the pre-European session on Thursday. In doing so, the pair bounces off Tuesday’s low. However, the pair still remains below the monthly resistance line while the MACD flashes the bearish signals for the first time in a week, which in turn portrays the underlying weakness to recall the bears.
While 23.6% Fibonacci retracement of the pair’s fall between December 24 and January 16, at 0.9665, acts as the immediate support, major attention will be given to the monthly low surrounding 0.9610.
If at all the sellers dominate below 0.9610, September 2018 low near 0.9540 will

Read More »

USD/CHF Price Analysis: 21-day SMA, seven-week-old falling trendline question buyers

January 22, 2020

USD/CHF registers five-day winning streak, rises to a one-week high.
A downside break of 0.9644 can refresh monthly lows.
38.2% Fibonacci retracement could lure buyers during further upside.
USD/CHF takes the bids to 0.9700, following the intra-day high of 0.9702, while heading into the European session on Wednesday.
The pair nears the key short-term resistance confluence including 21-day SMA 23.6% Fibonacci retracement of the pair November-January fall and a descending trend line since December 06 around 0.9707/13.
Should prices manage to provide a daily closing beyond 0.9717, an extended run-up to 38.2% Fibonacci retracement level of 0.9770 can’t be ruled out.
Meanwhile, lows marked on December 31 and January 17 highlights 0.9644 as the immediate support, a

Read More »

USD/CHF Price Analysis: Buyers look for entry beyond 0.9650/55

January 17, 2020

USD/CHF holds onto recovery gains from a 16-month low.
200-hour SMA will please buyers during a sustained breakout.
Bears may aim for September 2018 low following the downside break of the recent bottom.
USD/CHF confronts a one-week-old falling trend line resistance while trading around 0.9650 during early Friday. The pair recently ticked up to 0.9654 but failed to extend the rise.
Hence, buyers will look for entry above 0.9650/55 area while targeting a 200-hour SMA level around 0.9700.
It’s worth mentioning that the pair’s run-up beyond 0.9700 depends upon how well it manages to hold the rise past-January 14 top of 0.9715.
Meanwhile, pair’s declines below the recent low of 0.9612 may catch breath around 0.9600 ahead of plummeting to September 2018 bottom of

Read More »

USD/CHF Technical Analysis: Heavy inside monthly rising trend-channel, 0.9700 in focus

January 13, 2020

USD/CHF stays below the five-week-old falling trend line, 23.6% Fibonacci retracement.
Bearish MACD increases the odds of the pair’s declines.
Channel’s resistance, 50% Fibonacci retracement will question buyers during the recovery.
USD/CHF registers modest changes while taking rounds to 0.9730 ahead of the European session on Monday. The pair recently reversed from a descending trend line since December 06 while also slipping beneath 23.6% Fibonacci retracement of the declines from November 29 to December 31.
Even so, sellers are afraid of entry unless USD/CHF prices dip below the support line of the two-week-old rising trend channel, at 0.9705 now.
In doing so, 0.9660 and the year 2019 low near 0.9646 will be on the Bear’s radar.
If at all traders ignore bearish

Read More »

USD/CHF Technical Analysis: Sellers hopeful on Doji formation below monthly trendline

January 10, 2020

USD/CHF portrays buyers’ exhaustion despite the absence of losses since Tuesday.
December month low will be the key to watch.
USD/CHF trades mostly unchanged around 0.9730 while heading into the European session on Friday. The pair formed a Doji candlestick on the daily (D1) chart by Thursday’s end after recovering for the two consecutive prior days.
Considering the candlestick formation indicating the reversal of the previous trend, coupled with the pair’s sustained trading below a downward sloping trend line since December 06, the pair’s further recovery is doubtful.
As a result, sellers will look for entry below Thursday’s low of 0.9711 while targeting 0.9675 and the 2019-end low of 0.9645.
During the quote’s extended downpour beneath 0.9645, 0.9600 and

Read More »

USD/CHF Technical Analysis: Weak below six-week-old falling trendline

January 8, 2020

USD/CHF recovers amid the recent risk reset.
200-bar SMA adds to the upside barrier, 2019 low holds the key to further declines.
USD/CHF bounces off the intra-day low of 0.9665 to 0.9702 while heading into the European session on Wednesday. The pair benefits from the absence of immediate US-Iran war after Tehran hit US bases in Iraq.
Even so, the pair stays well below the descending trend line since November 29, at 0.9730, which limits the near-term advances.
Should the pair manages to clear 0.9730, it can rise to December 19 low near 0.9770. However, a 200-bar SMA level around 0.9830 could restrict the pair’s further advances.
In a case where the bulls dominate past-0.9830, 0.9920 and November month high of 1.0024 will be on their radars.
Meanwhile, 0.9660 and

Read More »

USD/CHF Technical Analysis: Inside descending channel below 200-HMA

January 7, 2020

USD/CHF clings to 23.6% Fibonacci retracement of the pair’s downpour from Christmas to December 31.
The falling channel, 200-HMA will challenge the Bullish MACD.
The current month top will lure the buyers during further upside.
The USD/CHF pair’s latest recovery seems to struggle around 0.9690 during early Tuesday. A short-term falling trend channel and prices below 200-Hour Moving Average (HMA) seem to question the recently bullish MACD.
As a result, buyers will look for a clear break of 200-HMA level of 0.9722 ahead of targeting the month’s top near 0.9745. It’s worth mentioning that the channel’s resistance-line, at 0.9700, can become an immediate upside barrier.
If at all USD/CHF prices remain strong beyond 0.9745, 0.9770 and December 25 top near 0.9830 will

Read More »

USD/CHF stalls three-day winning streak amid broad USD pullback

January 6, 2020

USD/CHF fails to hold onto recovery gains from multi-month lows.
Doubts over Iran/Iraq’s capacity to retaliate the US might have shuffled the risk tone.
Comments from the NY Fed, GT headlines add to the greenback’s weakness.
USD/CHF refrains from extending the recent recovery while trading around 0.9700 during the pre-European session on Monday. The pair seems to portray the recent risk reshuffle and the US catalysts while stepping back from the weekly top.
Risk reshuffle…
Although the US and Iran are flashing signs as if they’re heading to the war, catalysts show that there are limited signs of it. First among them is France, Germany and the UK’s push for de-escalation of risks. Secondly, the Washington Post doubts the Iraqi PM’s ability to push the US out as

Read More »

USD/CHF Technical Analysis: Eyes on short-term rising trendline after US strikes in Baghdad

January 3, 2020

USD/CHF drops after the news broke that the key members of Iran have been killed in by the US attack near Baghdad airport.
200-hour EMA, resistance line of immediate rising channel guard adjacent upside.
December month low adds to the support.
USD/CHF declines to 0.9700 during the early Friday’s trading. The quote recently slipped as the Swiss Franc (CHF) strengthened, due to its safe-haven appeal, after the US-Middle East tensions are about to get worst.
Read: US officials confirm responsibility for missile attack at Baghdad airport, killing Qassim Soleimani 
The pair now seems to decline to the support line of the short-term rising channel, at 0.9685, a break of which could extend the fall to December month’s low near 0.9645.
It should, however, be noted that

Read More »