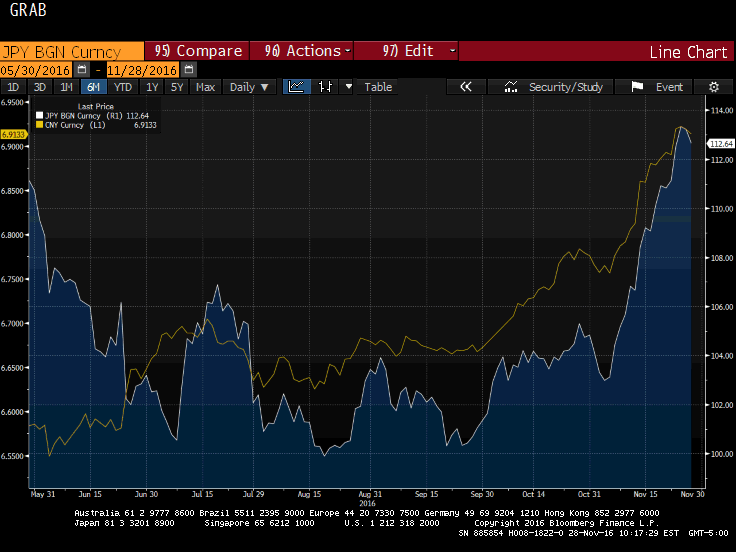
The US dollar has rallied against both the Japanese yen and Chinese yuan since the end of September. Through today, the yen has fallen 9.8% and the yuan has fallen by 3.5%. What they have in common is the rise in US interest rates relative to their own. Since September 30, the US 10-year yield has from below 1.60% to above 2.40% at the end of last week. Japan’s 10-year yield has risen from minus nine basis points at the end of September to five basis points before last weekend. China’s 10-year yield rose from 2.73% to 2.90% ten days ago. Many have suggested this Great Graphic, which we duplicated on Bloomberg, captures the essence of what is happening. The while line shows the dollar against the yen and the yellow line shows the dollar against the yuan. While the two look likely are moving together, beware of optical illusions. One of the most striking things about displaying the data like this is it looks like the yen and yuan have moved by the same amount. They have not. The illusion is created by showing the two time series on one chart but two scales. JPY BGN Curncy. - Click to enlarge Here is what the chart looks like like when the two time series are normalized to begin the period at 100. This rendition is truer to what has taken place.
Topics:
Marc Chandler considers the following as important: $CNY, Featured, FX Trends, Great Graphic, JPY, newslettersent, treasuries
This could be interesting, too:
Eamonn Sheridan writes CHF traders note – Two Swiss National Bank speakers due Thursday, November 21
Charles Hugh Smith writes How Do We Fix the Collapse of Quality?
Marc Chandler writes Sterling and Gilts Pressed Lower by Firmer CPI
Michael Lebowitz writes Trump Tariffs Are Inflationary Claim The Experts
| The US dollar has rallied against both the Japanese yen and Chinese yuan since the end of September. Through today, the yen has fallen 9.8% and the yuan has fallen by 3.5%.
What they have in common is the rise in US interest rates relative to their own. Since September 30, the US 10-year yield has from below 1.60% to above 2.40% at the end of last week. Japan’s 10-year yield has risen from minus nine basis points at the end of September to five basis points before last weekend. China’s 10-year yield rose from 2.73% to 2.90% ten days ago. Many have suggested this Great Graphic, which we duplicated on Bloomberg, captures the essence of what is happening. The while line shows the dollar against the yen and the yellow line shows the dollar against the yuan. While the two look likely are moving together, beware of optical illusions. One of the most striking things about displaying the data like this is it looks like the yen and yuan have moved by the same amount. They have not. The illusion is created by showing the two time series on one chart but two scales. |
JPY BGN Curncy |
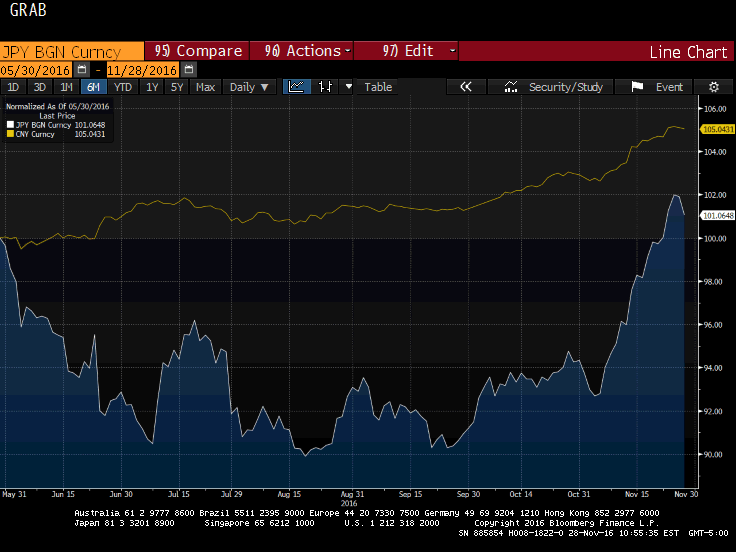
| Here is what the chart looks like like when the two time series are normalized to begin the period at 100. This rendition is truer to what has taken place. Over the past six month, the dollar has appreciated against the yuan, (yellow line) by 5%. It has been a gradual move, though it accelerated here in November.
The dollar’s appreciation against the yen (white line) has been a relatively new phenomenon. During most of the past six months, the dollar was lower against the yen than it began the period. At its best, last week, the dollar had risen 2% against the yen over the six month period. However, what cannot be eye-balled is the correlation of the yen and yuan. We ran the correlation of the two currencies on the percent change of each on a rolling 60-day basis. As recently as the middle of September, the correlation was near zero. It has spiked up and is over 0.5 now. It is the strongest correlation since at least 2005, when China abandoned its peg. To be sure, the correlation does not imply cause and effect. Instead, we continue to suggest that the best explanation is that both are the yuan and yen are correlated to a third thing–the rise in US interest rates. |
JPY BGN Curncy 2 |


