Swiss Franc Currency Index The Swiss Franc lost this week in particular against the euro, given that Mario Draghi was less dovish than expected. If the stronger euro is driven only by speculators, or also by “real money” (investments in cash, bonds, stocks) will be visible in Monday’s sight deposits release. Trade-weighted index Swiss Franc, March 11(see more posts on Swiss Franc Index, ) Source: markets.ft.com - Click to enlarge Swiss Franc Currency Index (3 years) The Swiss Franc index is the trade-weighted currency performance (see the currency basket)On a three years interval, the Swiss Franc had a weak performance. The dollar index was far stronger. The dollar makes up 33% of the SNB portfolio and 25% of Swiss exports (incl. countries like China or Arab countries that use the dollar for exchanges). Contrary to popular believe, the CHF index gained only 1.73% in 2015. It lost 9.52% in 2014, when the dollar (and yuan) strongly improved. Swiss Franc Currency Index (3 years), March 11(see more posts on Swiss Franc Index, ) Source: markets.ft.com - Click to enlarge USD/CHF Bringing forward expectations of a Fed hike from May-June to March was worth something for the dollar, but to get more now, the market may need to recognize the risk of three (or more) hikes this year.
Topics:
George Dorgan considers the following as important: Australian Dollar, Bollinger Bands, British Pound, Canadian Dollar, Crude Oil, EUR-USD, EUR/CHF, Euro, Euro Dollar, Featured, FX Trends, Japanese Yen, MACDs Moving Average, Mario Draghi, newsletter, RSI Relative Strength, S&P 500 Index, S&P 500 Index, Stochastics, Swiss Franc Index, U.S. Treasuries, US Dollar Index, USD/CHF, USDJPY
This could be interesting, too:
Nachrichten Ticker - www.finanzen.ch writes Krypto-Ausblick 2025: Stehen Bitcoin, Ethereum & Co. vor einem Boom oder Einbruch?
Connor O'Keeffe writes The Establishment’s “Principles” Are Fake
Per Bylund writes Bitcoiners’ Guide to Austrian Economics
Ron Paul writes What Are We Doing in Syria?
Swiss Franc Currency IndexThe Swiss Franc lost this week in particular against the euro, given that Mario Draghi was less dovish than expected. If the stronger euro is driven only by speculators, or also by “real money” (investments in cash, bonds, stocks) will be visible in Monday’s sight deposits release. |
Trade-weighted index Swiss Franc, March 11(see more posts on Swiss Franc Index, )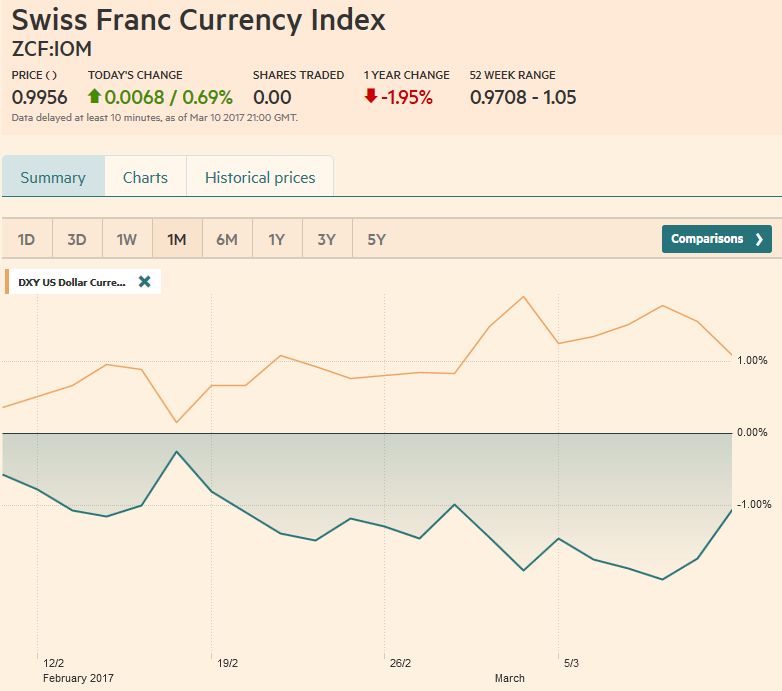 Source: markets.ft.com - Click to enlarge |
Swiss Franc Currency Index (3 years)The Swiss Franc index is the trade-weighted currency performance (see the currency basket)On a three years interval, the Swiss Franc had a weak performance. The dollar index was far stronger. The dollar makes up 33% of the SNB portfolio and 25% of Swiss exports (incl. countries like China or Arab countries that use the dollar for exchanges).
|
Swiss Franc Currency Index (3 years), March 11(see more posts on Swiss Franc Index, )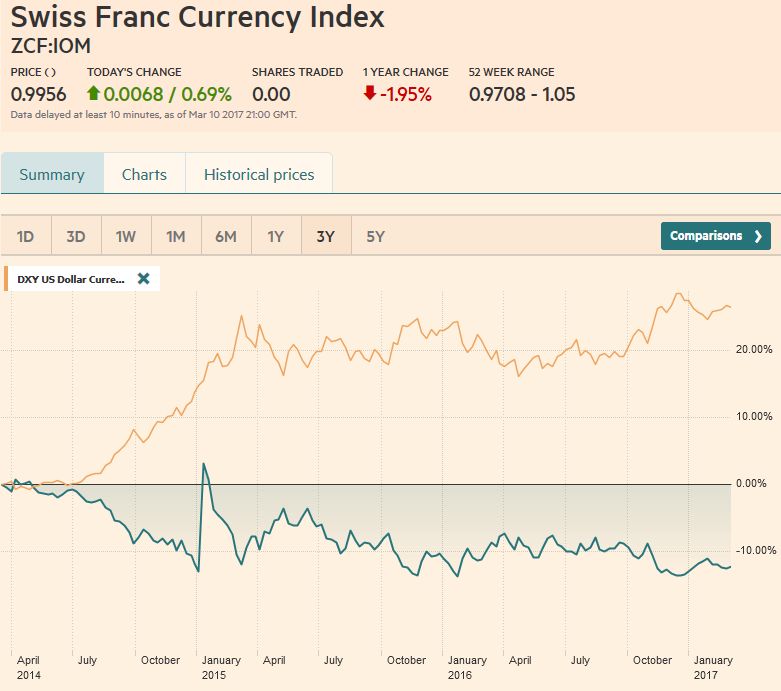 Source: markets.ft.com - Click to enlarge |
USD/CHFBringing forward expectations of a Fed hike from May-June to March was worth something for the dollar, but to get more now, the market may need to recognize the risk of three (or more) hikes this year. With the strong February jobs growth and a 2.8% year-over-year increase in hourly earnings, rarely does the market’s confidence in an event surpass current expectations for a hike on March 15.
However, the market sees around a one-in-three or a
one-in-four chance of a third hike this year. The risks for the updated forecasts from the Federal Reserve seem asymmetrically tilted higher, more rate hikes than fewer by more members. The hawkishness of regional presidents may be underestimated. The data and the global climate are conducive for expediting the normalization process. The hawks will likely feel vindicated by recent developments and may press their case with more vigor. The focus of the Fed has arguably shifted. Previously, the issue was whether the data would confirm that the economy was evolving toward the Fed’s targets. It did. Rather than focus on the data points per se, officials appear more confident of the direction and resilience of the economy and prices. They now are looking for opportunities, which helps explain the campaign to prepare the market for the March 15 move.
|
US Dollar/Swiss Franc FX Spot Rate, March 11(see more posts on USD/CHF, )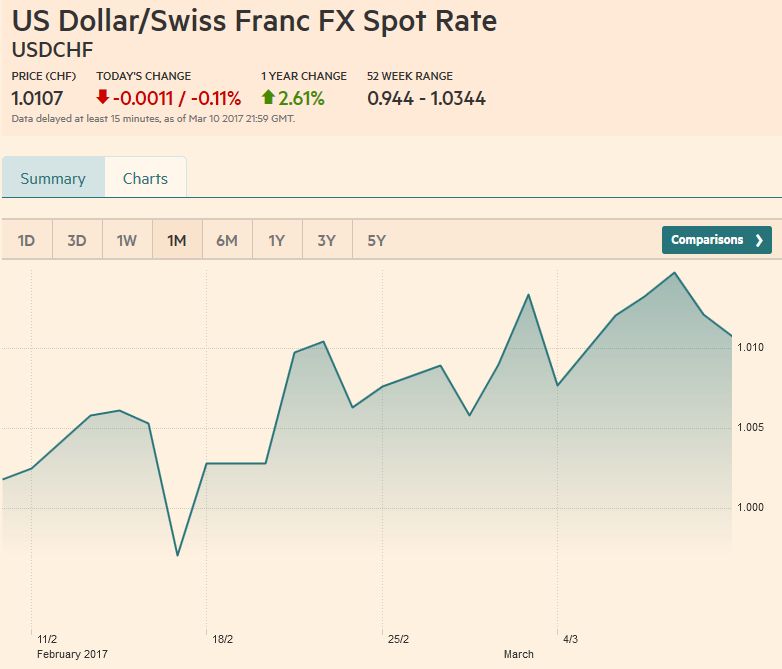 Source: markets.ft.com - Click to enlarge |
US Dollar IndexStill, the dollar’s technical tone has deteriorated, and the risk is on the downside over the next several sessions. Our working hypothesis is that the dollar’s recovery that began in early February against most of the majors ended and a correction has begun, For the Dollar Index, this means potential toward 100.75 and possibly 100.40. The former is the 50% retracement of that rally and coincides with the 100-day average (~100.80). The latter is the 61.8% retracement. Alternatively, if the Dollar Index has carved out a double top near 102.25, the neckline is around 101.20 (38.2% of the rally is ~101.10). On a break of the neckline, the measuring objective is 100. |
US Dollar Currency Index, March 11(see more posts on U.S. Dollar Index, )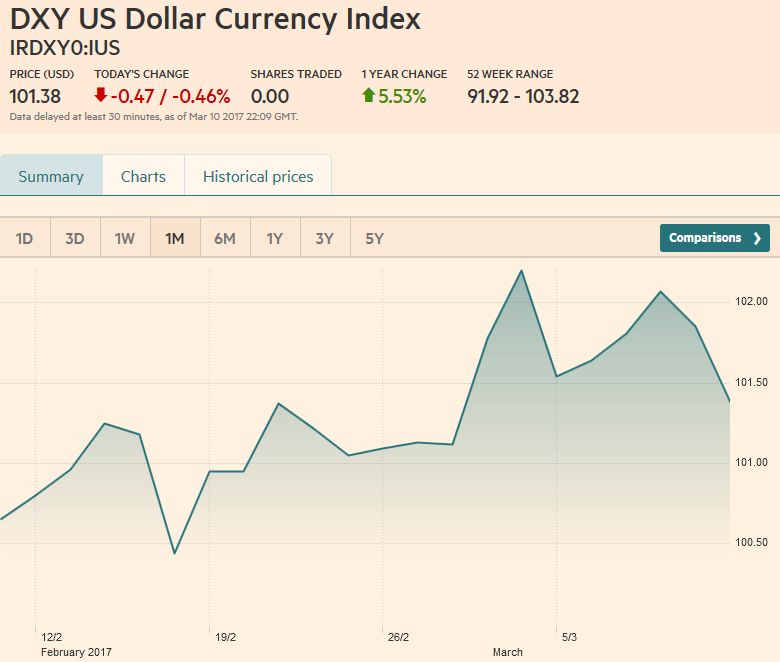 Source: markets.ft.com - Click to enlarge |
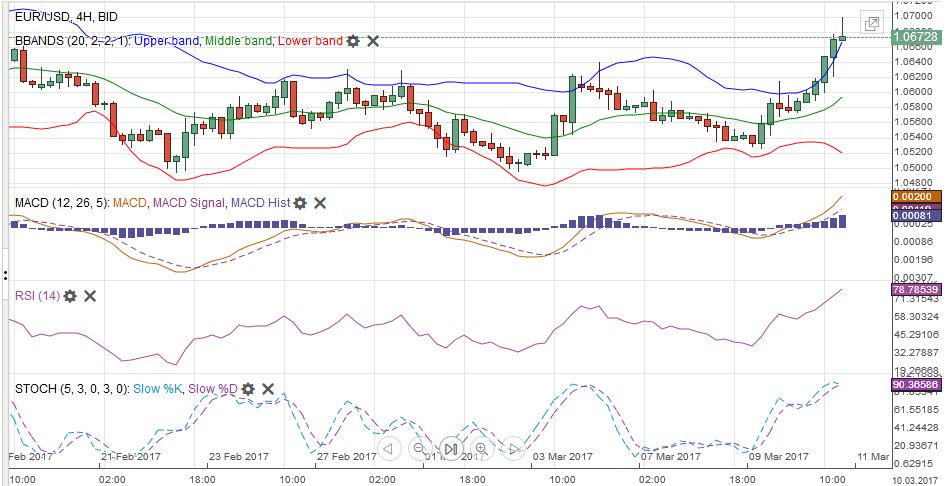
EUR/USDThe euro’s pre-weekend rally saw it surpass the 50% retracement objective of its decline from the February 2 high near $1.0830. That retracement was around $1.0660, and the 61.8% retracement is closer to $1.0700. The euro’s five-day moving average crossed above the 20-day average for the first time in a month. The single currency may be tracing out a double bottom at $1.05. The neckline is $1.0630. The measuring objective is around $1.0760. |
EUR/USD with Technical Indicators, March 06 - 11(see more posts on Bollinger Bands, EUR / USD, MACDs Moving Average, RSI Relative Strength, Stochastics, ) |
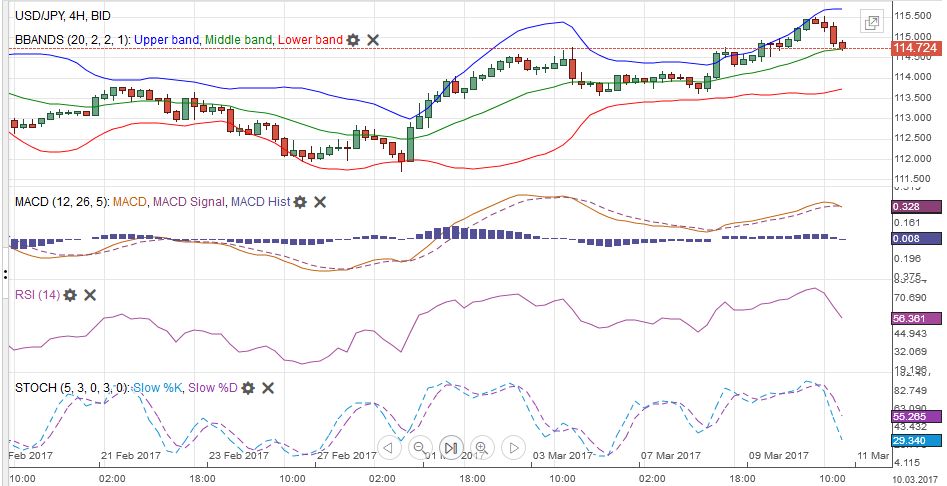
USD/JPYAfter reaching its highest level since January 19, the dollar reversed lower against the Japanese yen, leaving a bearish shooting star candlestick pattern. If JPY115 area is the upper end of the range, then JPY111.50 is the lower end. But before seeing that, the JPY114.30-JPY114.60 may prove sticky, and several technical signals converge near JPY113.60, including the 20-day moving average, the 50% retracement of this month’s advance, and the past week’s lows.
|
USD/JPY with Technical Indicators, March 06 - 11(see more posts on Bollinger Bands, MACDs Moving Average, RSI Relative Strength, Stochastics, USD/JPY, ) |
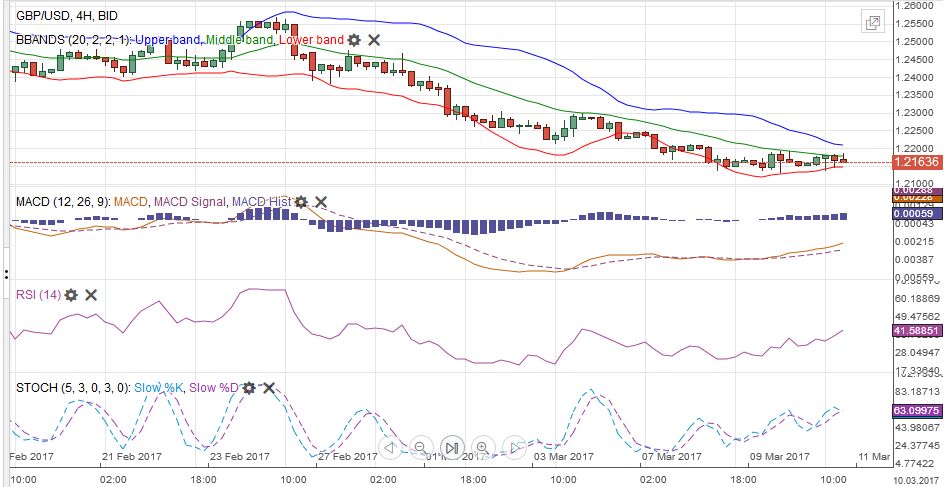
GBP/USDSterling has risen in two of the past 11 sessions, and they were both on Fridays. Even before Friday’s recovery, sterling’s downside momentum was fading near $1.2140. The upside is not inspiring. It spent the last two sessions unable to move above $1.22. That has been done previously in this cycle. The RSI and MACDs show no compelling reason to pick a bottom, while the Slow Stochastics appears to be bottoming at over-extended levels. A close above the five-day, which has not happened since February 23 might be a preliminary sign that a correction has begun. It is finished last week a little above $1.2185. Even then, the $1.23 area may provide a formidable ceiling. Sterling bears have had little of the pain that is often necessary to spur position adjustments. |
GBP/USD with Technical Indicators, March 06 - 11(see more posts on Bollinger Bands, GBP/USD, MACDs Moving Average, RSI Relative Strength, Stochastics, ) |
AUD/USD |
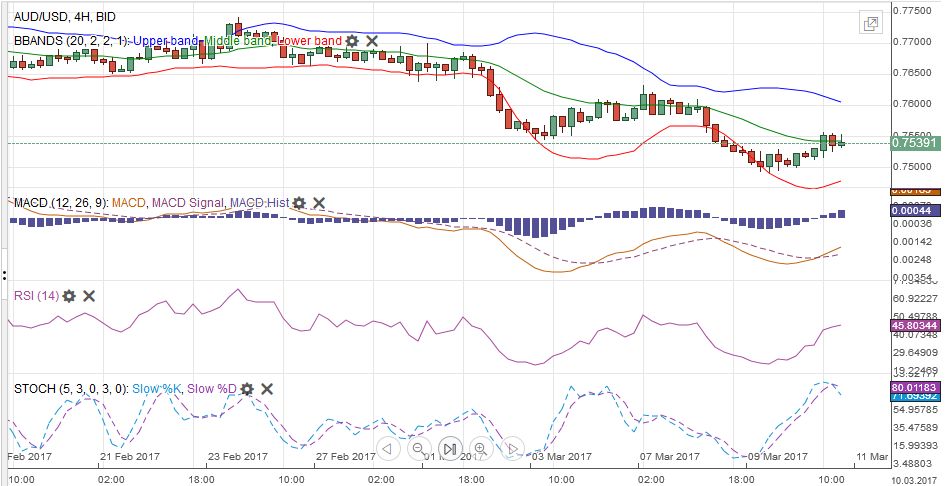
AUD/USD with Technical Indicators, March 06 - 11(see more posts on Australian Dollar, Bollinger Bands, MACDs Moving Average, RSI Relative Strength, Stochastics, ) |
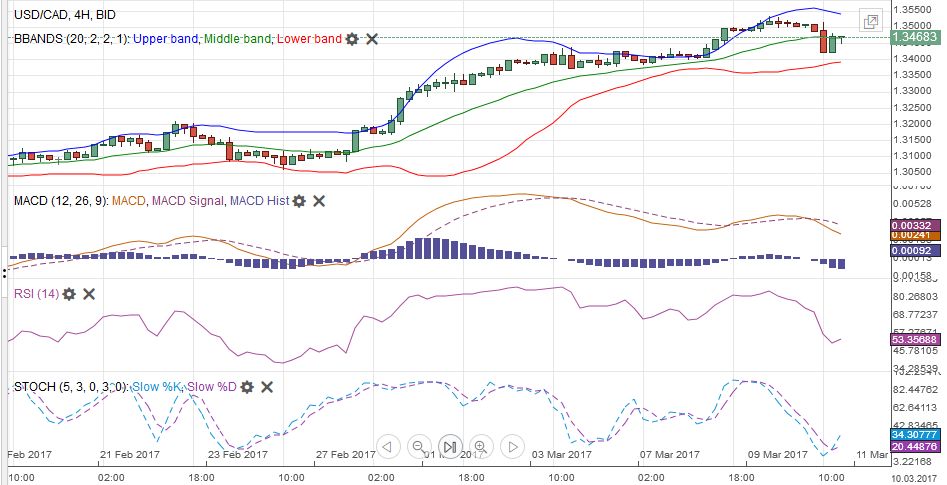
USD/CADThe US dollar rallied from CAD1.3060 on February 25 to CAD1.3535 on March 9. The RSI and Slow Stochastics warn the move is over. Initial support is seen near CAD1.3400 and then CAD1.3350. During the same period, the Australian dollar fell from around $0.7740 to a little below $0.7500. Initial corrective targets are fond in the $0.7560-$7580 area and then $0.7620. |
USD/CAD with Technical Indicators, March 06 - 11(see more posts on Bollinger Bands, Canadian Dollar, MACDs Moving Average, RSI Relative Strength, Stochastics, ) |
Crude OilOPEC is producing more oil than expected and US inventories continue to rise. Oil prices fell every day last week, culminating with a 9% loss on the week. It was the largest weekly fall in over a year. The May light sweet crude oil futures contract returned to levels last since this past November, dipping below $49 a barrel before the weekend and finished poorly (just above the session lows). The market is extended as illustrated by three consecutive closes below the lower Bollinger Band (~$50.30). That said, speculative market positioning was extreme and long. The Bollinger Band will move toward prices, but the $50 a barrel area may cap a technical bounce. The $46-$48 a barrel level basis the May contract offers strong support. |
Crude Oil, March 2016 - March 2017(see more posts on Crude Oil, )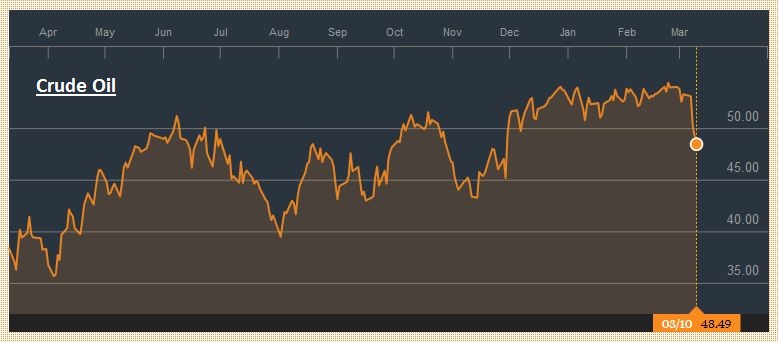 Source: Bloomberg.com - Click to enlarge |
U.S. TreasuriesThe US 10-year Treasury yields increased for nine consecutive sessions, over which time, it rose a little more than 30 bp to test the high water mark from the end of the year. It had been recorded near 2.64% the day after the December Fed hike. After such a run, some sideways movement ought not to be surprising. Provided it holds above 2.50%, the pullback is not significant. The June note futures contract bottomed before the weekend at 122-20 and settled near its highs (above 123). Resistance is seen first around 123-10 and then ahead of 124-00. |
Yield US Treasuries 10 years, Mar 2016 - Mar 2017(see more posts on U.S. Treasuries, )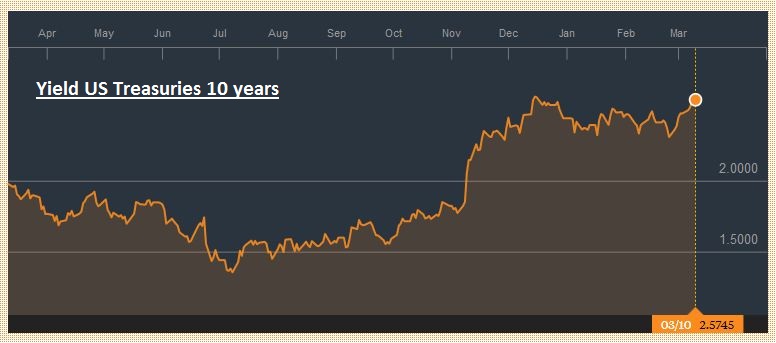 Source: Bloomberg.com - Click to enlarge |
S&P 500 IndexThe S&P 500 extended its downside move in the first three days of last week and then recovered in the last two. Recall that the S&P 500 peaked on March 1 near 2400. It approached but held above the support we identified near 2350. The two-day recovery at the end of last week saw it recoup nearly 50% of its slide. The 61.8% retracement is near 2383. Despite the firmer tone over the last two sessions, many investors are concerned on valuation grounds, and there is increased talk of the adage about three steps (Fed hikes) and a stumble. |
S&P 500 Index, March 11(see more posts on S&P 500 Index, )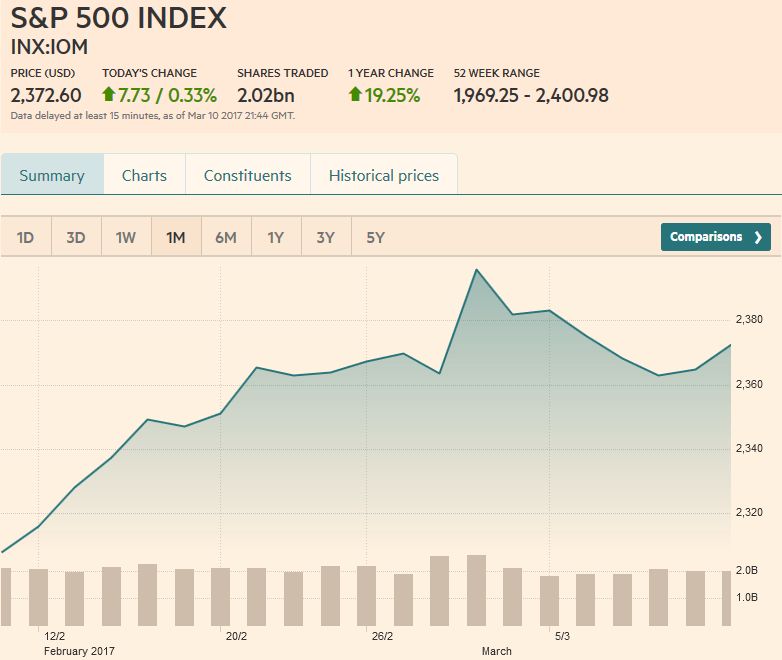 Source: markets.ft.com - Click to enlarge |
Tags: Australian Dollar,Bollinger Bands,British Pound,Canadian Dollar,Crude Oil,Dollar Index,EUR / USD,EUR/CHF,Euro,Euro Dollar,Featured,Japanese yen,MACDs Moving Average,Mario Draghi,newsletter,RSI Relative Strength,S&P 500 Index,Stochastics,Swiss Franc Index,U.S. Treasuries,USD/CHF,USD/JPY

