Swiss Franc Currency Index The Swiss Franc showed some improvement at the end of the week, when recovered some of the losses seen this month. Trade-weighted index Swiss Franc, October 28, 2016(see more posts on Swiss Franc Index, ) - Click to enlarge Swiss Franc Currency Index (3 years) The Swiss Franc index is the trade-weighted currency performance (see the currency basket) On a three years interval, the Swiss Franc had a weak performance. The dollar index was far stronger. The dollar makes up 33% of the SNB portfolio and 25% of Swiss exports (incl. countries like China or Arab countries that use the dollar for exchanges). Contrary to popular believe, the CHF index gained only 1.73% in 2015. It lost 9.52% in 2014., when the dollar (and yuan) strongly improved. Swiss Franc Currency Index, October 28, 2016(see more posts on Swiss Franc Index, ) - Click to enlarge The USD/CHF remains close to the monthly highs of 0.99. Mosts texts by Marc Chandler My articles My siteAbout meMy booksFollow on:TwitterAmazonSeeking AlphaLinkedIN The US dollar rose against most of the major currencies last week, but the upside momentum appeared to be dissipating, even before the FBI’s announcement about new Clinton emails.
Topics:
George Dorgan considers the following as important: Australian Dollar, Canadian Dollar, Crude Oil, EUR/CHF, Euro, Euro Dollar, Featured, FX Trends, Japanese Yen, MACDs, newslettersent, S&P 500 Index, Swiss Franc Index, U.S. Treasuries, US Dollar Index, USD/CHF, USDJPY
This could be interesting, too:
Eamonn Sheridan writes CHF traders note – Two Swiss National Bank speakers due Thursday, November 21
Charles Hugh Smith writes How Do We Fix the Collapse of Quality?
Marc Chandler writes Sterling and Gilts Pressed Lower by Firmer CPI
Michael Lebowitz writes Trump Tariffs Are Inflationary Claim The Experts
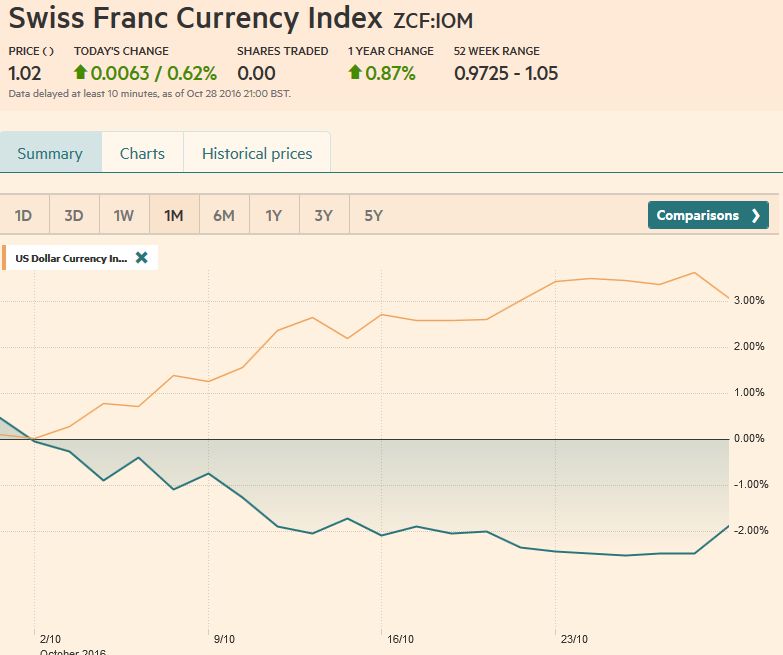
Swiss Franc Currency IndexThe Swiss Franc showed some improvement at the end of the week, when recovered some of the losses seen this month. |
Trade-weighted index Swiss Franc, October 28, 2016(see more posts on Swiss Franc Index, ) |
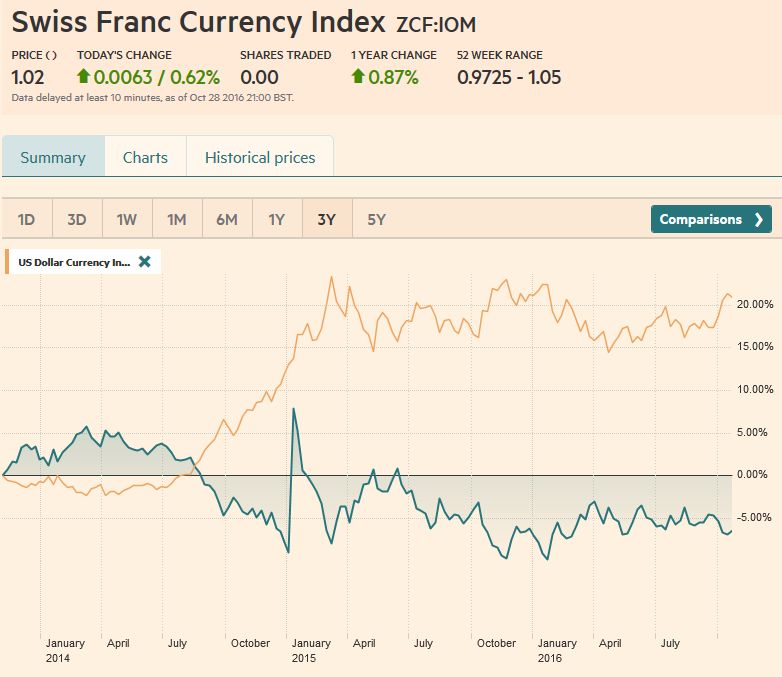
Swiss Franc Currency Index (3 years)The Swiss Franc index is the trade-weighted currency performance (see the currency basket)On a three years interval, the Swiss Franc had a weak performance. The dollar index was far stronger. The dollar makes up 33% of the SNB portfolio and 25% of Swiss exports (incl. countries like China or Arab countries that use the dollar for exchanges). Contrary to popular believe, the CHF index gained only 1.73% in 2015. It lost 9.52% in 2014., when the dollar (and yuan) strongly improved. |
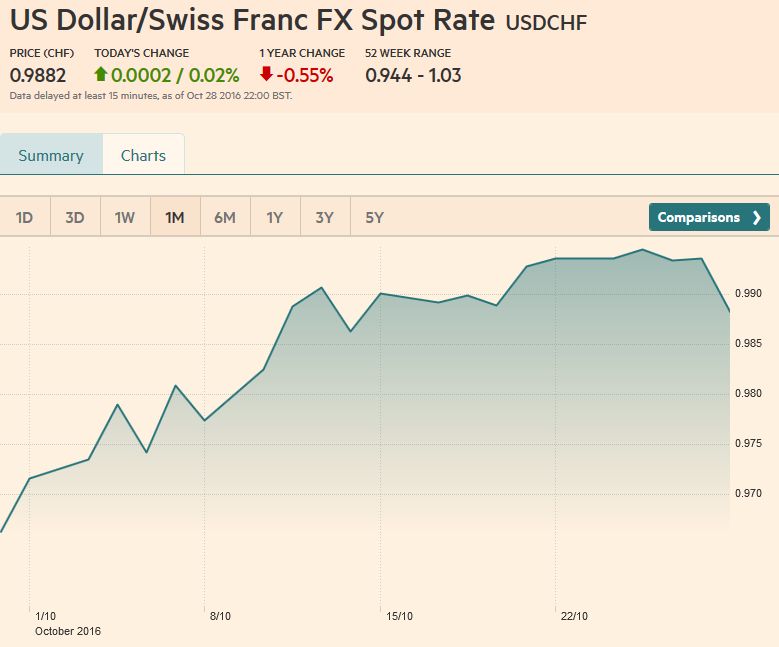
Swiss Franc Currency Index, October 28, 2016(see more posts on Swiss Franc Index, ) |
| The USD/CHF remains close to the monthly highs of 0.99.
The US dollar rose against most of the major currencies last week, but the upside momentum appeared to be dissipating, even before the FBI’s announcement about new Clinton emails. There are a few exceptions like the greenback’s performance against the Japanese yen, Canadian dollar, and Swedish krona. The dollar made new multi-month highs against all three currencies in the last two sessions. We suspect that much of the near-term good news for the dollar is passed. Next week, the FOMC statement is likely to be similar in tone and substance to the September statement, and the employment report may moderate. On balance, we look for the dollar to correct lower over the next week or so. |
US Dollar - Swiss Franc FX Spot Rate, October 28, 2016(see more posts on USD/CHF, ) |
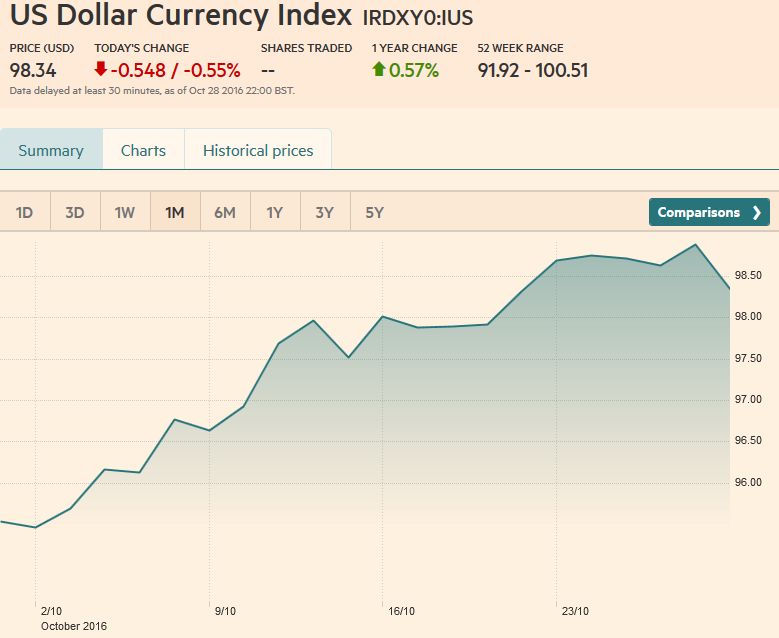
US Dollar IndexThe US Dollar Index snapped a three-week advancing streak. After pushing through 99.00 for the first time since February, the upside momentum faded. The first band of support is seen around 98.00-98.20. A break of 97.60 would be significant. There may be a small bearish divergence with the RSI that did not make new highs with prices, and the MACDs are about to cross lower. The Slow Stochastics have already turned. |
US Dollar Currency Index, October 28, 2016(see more posts on Dollar Index, ) |
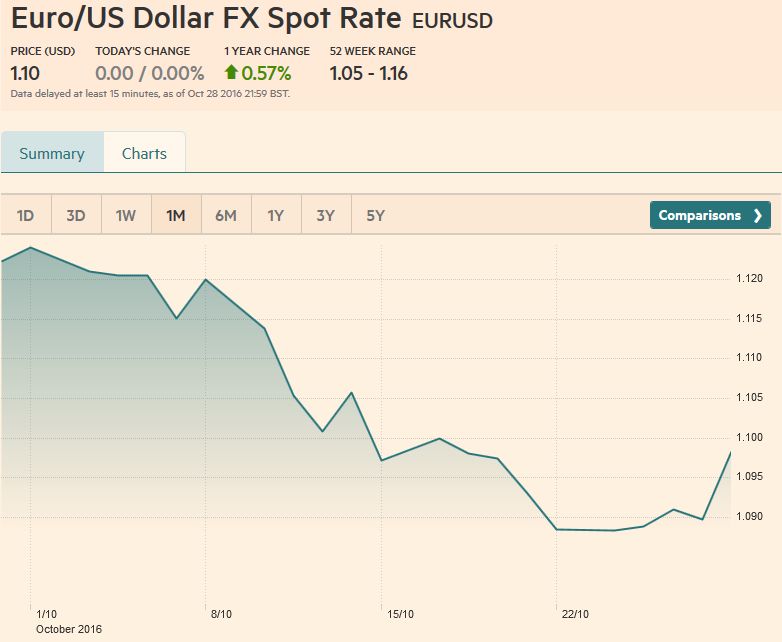
EUR/USDThe euro found a bid on October 25 near $1.0850. It proceeded to record higher lows for the following three consecutive sessions. The week’s high was recorded after the US reported somewhat stronger than expected Q3 GDP at near $1.0950, but news that the FBI would re-open the investigation into Clinton’s email sent the euro to almost $1.10. Above there, $1.1040-$1.1060 may offer resistance. The $1.0940 area offers initial support. The technical indicators favor additional gains in the sessions ahead. |
Euro/US Dollar FX Spot Rate, October 28, 2016(see more posts on Euro Dollar, ) |
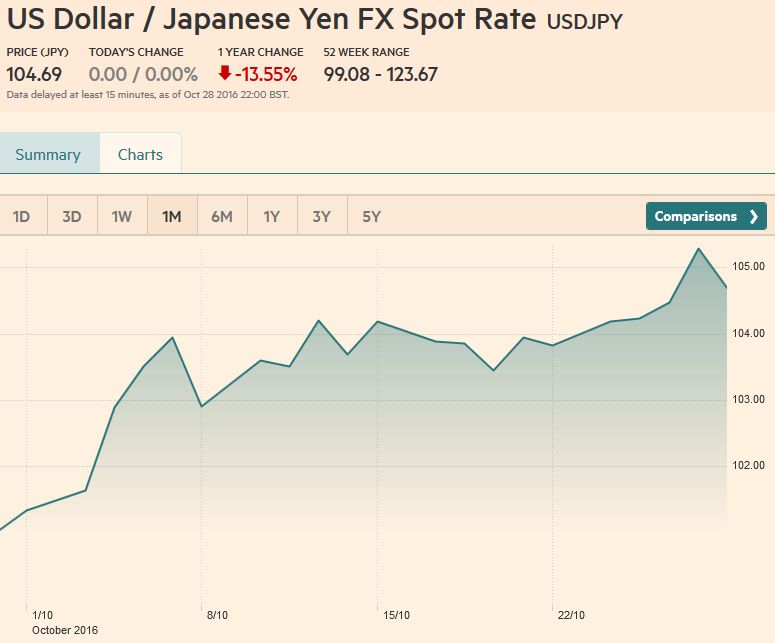
USD/JPYBefore the weekend, the dollar reached JPY105.50, its highest level since late-July. The technical indicators we use suggest there is scope for additional dollar gains, but the market was getting stretched before the Clinton news broke. After reversing lower, the dollar found support near JPY104.50, in front of a near-term trendline. A break of JPY104 could spur another leg lower toward JPY103.20. |
US Dollar / Japanese Yen FX Spot Rate, October 28, 2016(see more posts on USDJPY, ) |
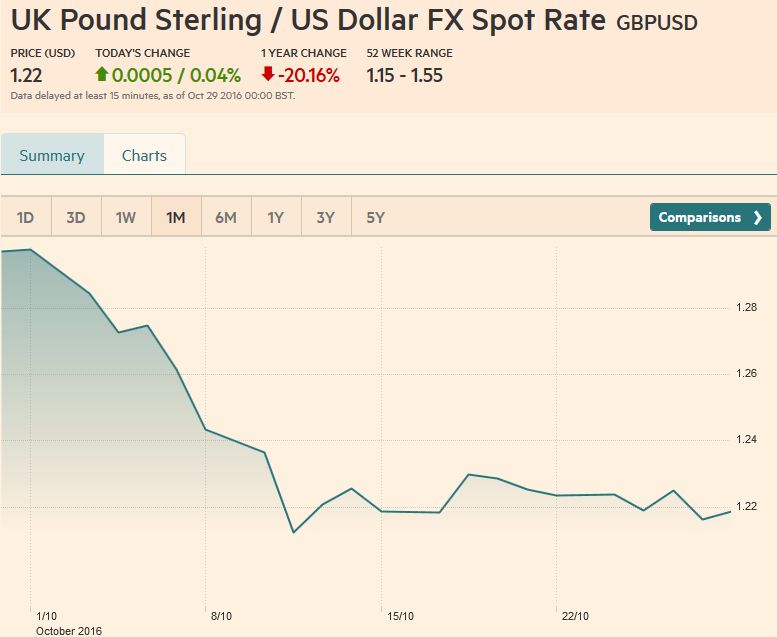
GBP/USDSince the flash crash, sterling has been trading in narrow ranges. With a brief exception on October 25, sterling has been confined to the $1.2090-$1.2375 range set on October 11. The technical indicators are not generating strong signals. The sideways movement seems to be alleviating the technically oversold condition without sterling sustaining an upside momentum. The euro was finding better traction against sterling in recent sessions. Initially, there is potential toward GBP0.9050. A move above there could spur a move back to GBP0.9200. A BOE rate cut, which would likely be the last, would likely weigh on sterling, but we don’t expect a move. |
UK Pound Sterling / US Dollar FX Spot Rate, October 28, 2016(see more posts on British Pound, ) |
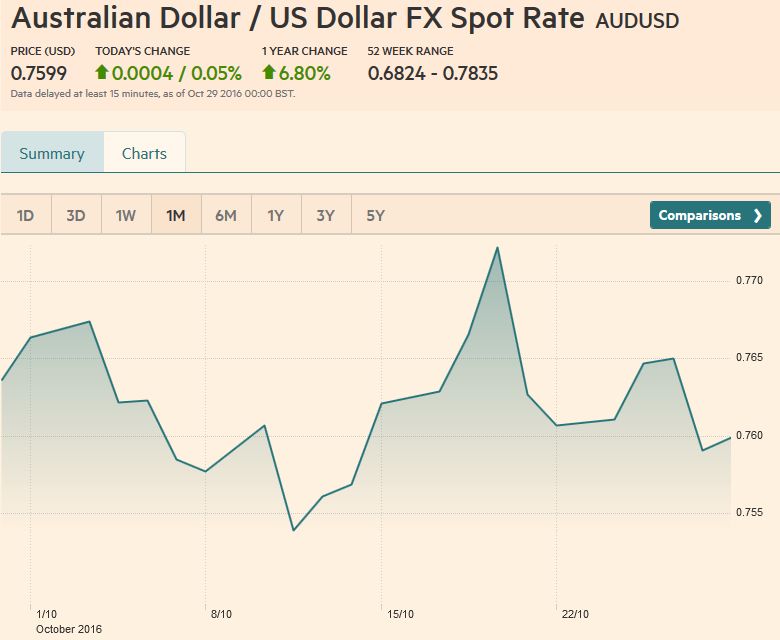
AUD/USDSlightly firmer than expected CPI figures helped lift the Australian dollar above the $0.7700 cap that has blocked the upside for several months. It reversed lower the same day and had fallen to $0.7560 by the end of the week. We are watching a trendline, drawn off the Jan, May, and Sept lows. It is found now near $0.7540 on Monday and rises toward $0.7555 by the end of the week. The technical indicators are mixed. The Reserve Bank of Australia meets but most likely will cut rates. Broadly speaking, the Aussie still seems range bound ($0.7500-$0.7700) and finished last week near the middle of the range. |
AUD/USD FX Rate Chart, October 28, 2016(see more posts on Australian Dollar, ) |
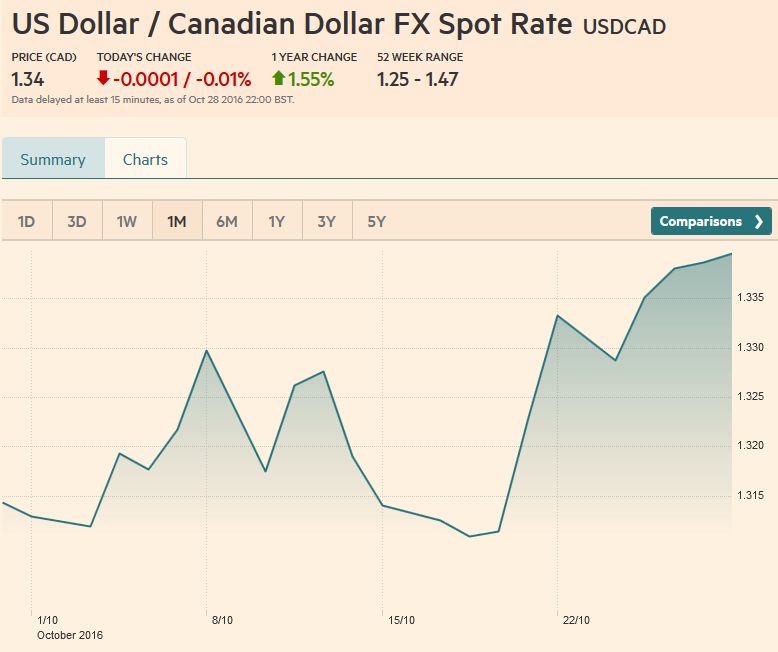
USD/CADThe US dollar was stalling near CAD1.34 before the Clinton news broke and surged to almost CAD1.3435, where the upper Bollinger Band is found. Nearby resistance is seen near CAD1.3450, but the next important retracement target is near CAD1.3575. A break of CAD1.3360-CAD1.3380 would suggest a near-term top is in place, and that the thin pre-weekend market exaggerated the implications of another FBI investigation into Clinton’s email. |
USD/CAD FX Rate Chart, October 28, 2016(see more posts on Canadian Dollar, ) |
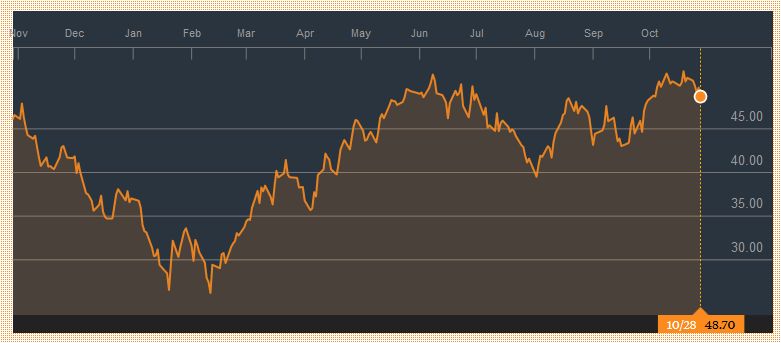
Crude OilOur idea that oil prices were rolling over continues to unfold. The December contract briefly slipped below $49 a barrel in the middle of last week, which is the lowest in three weeks. The five-day moving average crossed below the 20-day average for the first time since the end of September, which caught the nearly $8 a barrel bounce this month. The convincing break of the $50 level, which may be the neckline of a double top, projects toward $48. |
Crude Oil, October 28, 2016(see more posts on Crude Oil, ) |
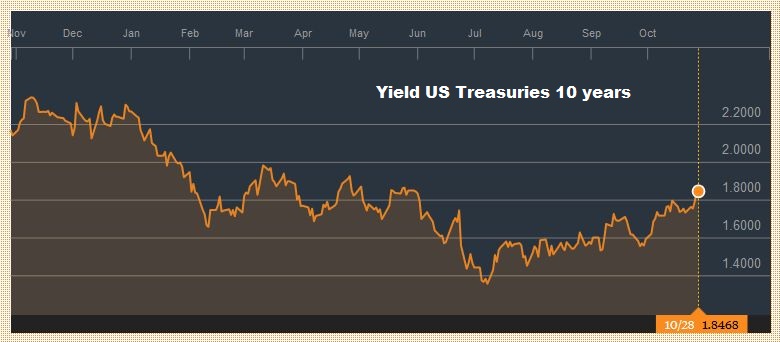
U.S. TreasuriesUS 10-year yields made new five-month highs before the weekend near 1.88%. The yield was 2.14% at the end of October 2015. The 10-year yield rose nine bp over the course of the week and about 28 bp on the month. Both the weekly and monthly rise was less than most of the major European countries, resulting in narrowed premiums. The December futures contract may have put in a near-term bottom and could recover back into the 130-00-to 130-10 area. |
Yield US Treasuries 10 years, October 28, 2016(see more posts on U.S. Treasuries, ) |
S&P 500 Index
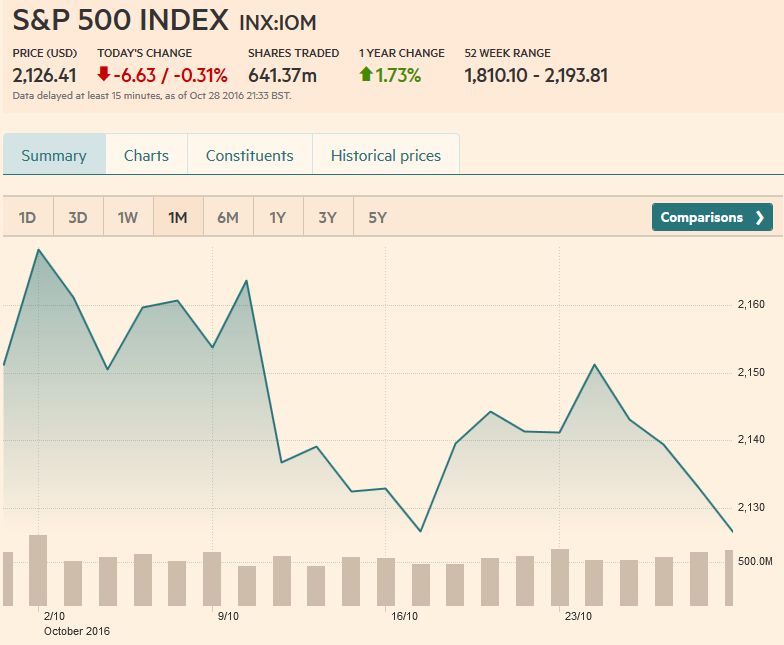
The S&P 500 finished last week with a four-session losing streak. It has fallen in six of the last seven sessions. The technical condition is soft and additional losses seem likely. The next target is in the 2114 area, with a break allowing for a test of 2100. |
S&P 500 Index, October 28, 2016(see more posts on S&P 500 Index, ) |

