See the introduction and the video for the terms gold basis, co-basis, backwardation and contango. Oil is Different Last week, we showed a graph of rising open interest in crude oil futures. From this, we inferred — incorrectly as it turns out — that the basis must be rising. Why else, we asked, would market makers carry more and more oil? We are grateful to Peter Tenebrarum at Acting Man and Steve Saville at The Speculative Investor for setting us straight. According to their data, oil has been in backwardation for many months. The rising open interest position is due to, among other players, increased hedging by producers. The gold market is unique, in that all of the gold produced over thousands of years is still
Topics:
Keith Weiner considers the following as important: 6) Gold and Austrian Economics, 6a) Gold & Bitcoin, Chart Update, commodities, Crude Oil, dollar price, Featured, Gold and its price, gold basis, Gold co-basis, gold price, gold silver ratio, newsletter, Precious Metals, silver basis, Silver co-basis, silver price
This could be interesting, too:
Nachrichten Ticker - www.finanzen.ch writes Krypto-Ausblick 2025: Stehen Bitcoin, Ethereum & Co. vor einem Boom oder Einbruch?
Connor O'Keeffe writes The Establishment’s “Principles” Are Fake
Per Bylund writes Bitcoiners’ Guide to Austrian Economics
Ron Paul writes What Are We Doing in Syria?
See the introduction and the video for the terms gold basis, co-basis, backwardation and contango.
Oil is DifferentLast week, we showed a graph of rising open interest in crude oil futures. From this, we inferred — incorrectly as it turns out — that the basis must be rising. Why else, we asked, would market makers carry more and more oil? We are grateful to Peter Tenebrarum at Acting Man and Steve Saville at The Speculative Investor for setting us straight. According to their data, oil has been in backwardation for many months. The rising open interest position is due to, among other players, increased hedging by producers. The gold market is unique, in that all of the gold produced over thousands of years is still in human hands. All of that metal is potential supply, at the right price and under the right conditions. And virtually all of the supply to the market today is existing gold stocks. Mine production is very small compared to total stocks. In our oil assessment, we implicitly accepted this unique gold market condition as being true for oil. We assumed that new contracts are carry trades made by market makers. However it is obvious that, as the price rises, oil producers ramp up production. And this creates a need to hedge. They sell their production forward. What is true for gold isn’t true for oil. |
 Crude oil acts differently from gold – and so do all other industrial commodities. - Click to enlarge What makes them different is that the supply of industrial commodities held in storage as a rule suffices to satisfy industrial demand only for a few months at most. By contrast, gold inventories are in theory large enough to satisfy fabrication and industrial demand for 70 years (“in theory” because this is under the assumption that there is no monetary or investment demand for gold). This is in fact one of the reasons why gold is the money commodity. [PT] Photo credit: Getty Images |
| Speculators were buying futures, figuring to profit from a rising price as they saw the backwardation (they were right until May 22). Thus there were two sides adding to their position sizes.
That is a bit of an oversimplification, but we will leave it to others who study the oil market to provide full analysis. Anyways, before we get back to our regular scheduled programming, gold and silver, we said something last week that we stand behind:
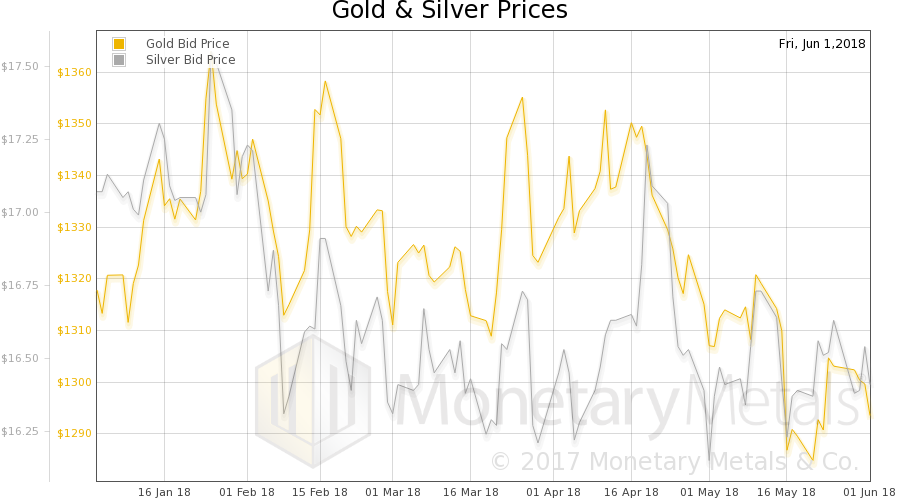
The prices of gold and silver, measured in the inflationary and unstable US dollar that some gold bugs still insist will collapse on July 1, but nevertheless use to measure gold and silver, fell $9 and $0.09 respectively. Measured in crude oil, whose supply and demand are both subject to massive gyrations due to the unstable interest rate in the dollar, gold rose from 19.18 barrels to 19.65. And silver rose from 0.24 barrels to 0.25 barrels. |
Gold vs. CRB since 1980 till 2018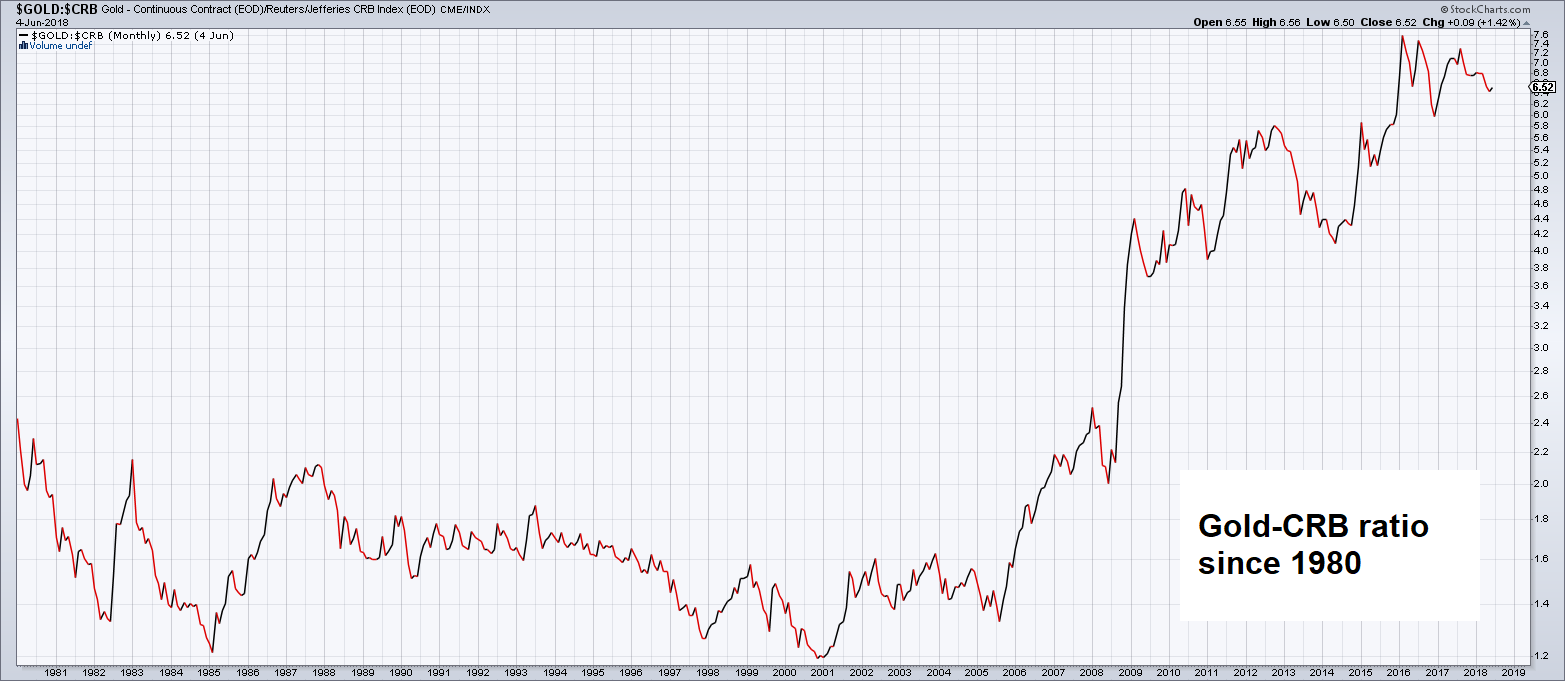 Gold vs. the CRB since 1980. Although this chart doesn’t show it, there is a very long term tendency for the gold price to rise against industrial commodity prices (often interrupted by wild fluctuations in the short to medium term). It is a trend that has been in place for thousands of years. [PT] - Click to enlarge |
Fundamental DevelopmentsAll joking aside, we will show the only true picture of the gold and silver fundamentals. But first, here is the chart of the prices of gold and silver. |
Gold and Silver Prices(see more posts on gold price, silver price, ) |
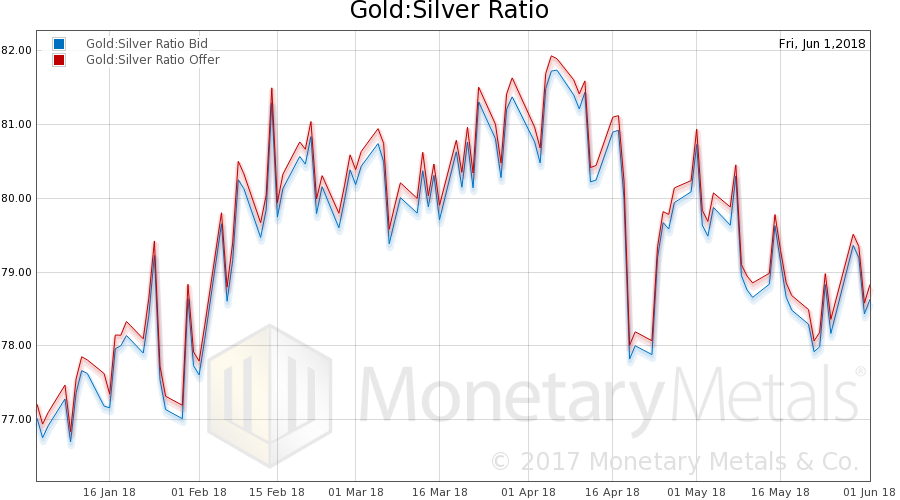
Gold:Silver RatioNext, this is a graph of the gold price measured in silver, otherwise known as the gold to silver ratio (see here for an explanation of bid and offer prices for the ratio). It was all but unchanged. |
Gold:Silver Ratio(see more posts on gold silver ratio, ) |
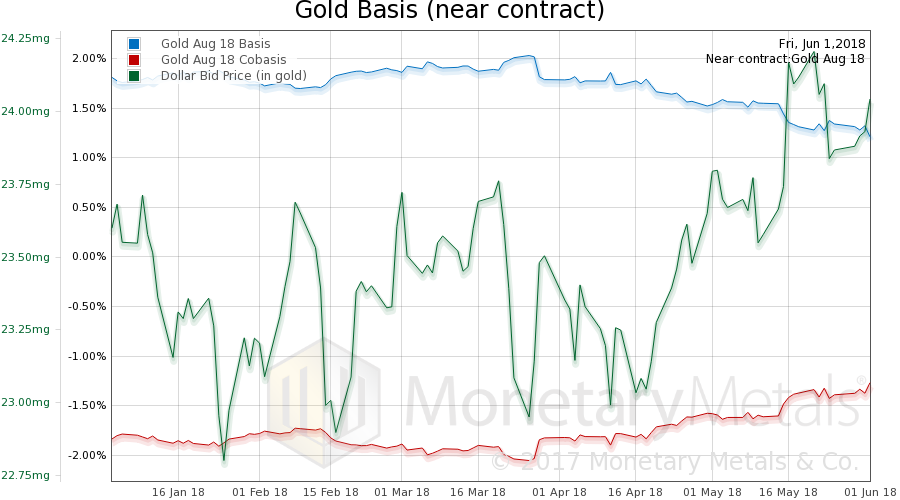
Gold Basis and Co-basis and the Dollar PriceHere is the gold graph showing gold basis, co-basis and the price of the dollar in terms of gold price. The price of the dollar rose (inverse of the price of gold, measured in dollars). Along with this, the scarcity of gold increased a bit. |
Gold Basis and Co-basis and the Dollar Price(see more posts on dollar price, gold basis, Gold co-basis, ) |
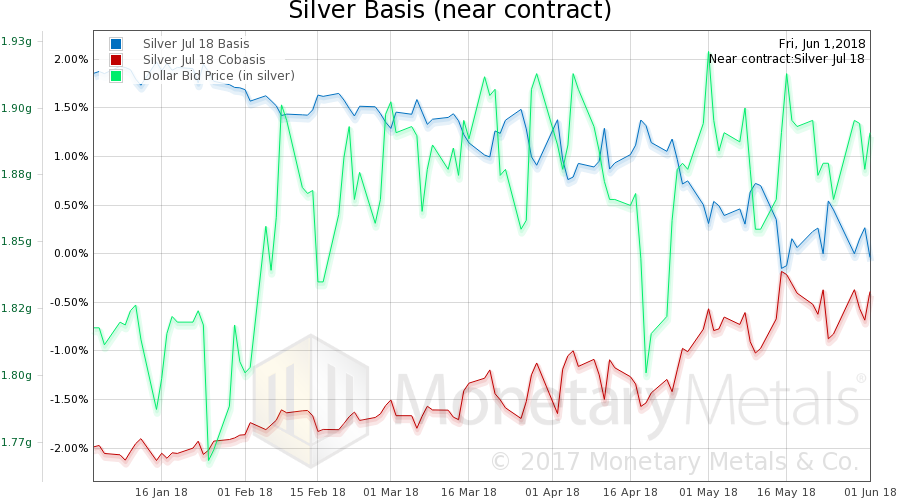
Silver Basis and Co-basis and Dollar PriceThe Monetary Metals Gold Fundamental Price fell $12 this week to $1,386. Now let’s look at silver. The same thing happened in silver, except the rise in scarcity was larger than in gold. At least in the near contract. The silver basis continuous shows a much smaller move up in the co-basis. |
Silver Basis and Co-basis and the Dollar Price(see more posts on dollar price, silver basis, Silver co-basis, ) |
The Monetary Metals Silver Fundamental Price rose 9 cents to $17.51.
© 2018 Monetary Metals
Charts by stockcharts, Monetary Metals
Chart and image captions by PT
Tags: Chart Update,commodities,Crude Oil,dollar price,Featured,gold basis,Gold co-basis,gold price,gold silver ratio,newsletter,Precious Metals,silver basis,Silver co-basis,silver price

