In the last update I wondered if growth expectations – and growth – were breaking out to the upside. 10 year Treasury yields were well over the 3% threshold that seemed so ominous and TIPS yields were nearing 1%, a level not seen since early 2011. It looked like we might finally move to a new higher level of growth. Or maybe not. 10 year yields fell nearly 40 basis points in a matter of days as did TIPS yields. The dollar rallied more, gold fell and crude oil lost a quick 11%. Some blamed the move on political turmoil in Italy but I’m not sure when there wasn’t political turmoil in Italy so maybe that was just a convenient scapegoat. Whatever the cause, investors have taken back some of the optimism they had built
Topics:
Joseph Y. Calhoun considers the following as important: 5) Global Macro, Bi-Weekly Economic Review, bonds, cfnai, China, commodities, consumer spending, copper/gold ratio, credit spreads, Crude Oil, currencies, economy, employment, Featured, Federal Reserve/Monetary Policy, Gold, inflation, Interest rates, Markets, newsletter, Personal Income, savings rate, sentiment, Taxes/Fiscal Policy, The United States, TIPS, trade, treasuries, US dollar, Yield Curve
This could be interesting, too:
Nachrichten Ticker - www.finanzen.ch writes Die Performance der Kryptowährungen in KW 9: Das hat sich bei Bitcoin, Ether & Co. getan
Nachrichten Ticker - www.finanzen.ch writes Wer verbirgt sich hinter der Ethereum-Technologie?
Martin Hartmann writes Eine Analyse nach den Lehren von Milton Friedman
Marc Chandler writes March 2025 Monthly
| In the last update I wondered if growth expectations – and growth – were breaking out to the upside. 10 year Treasury yields were well over the 3% threshold that seemed so ominous and TIPS yields were nearing 1%, a level not seen since early 2011. It looked like we might finally move to a new higher level of growth. Or maybe not.
10 year yields fell nearly 40 basis points in a matter of days as did TIPS yields. The dollar rallied more, gold fell and crude oil lost a quick 11%. Some blamed the move on political turmoil in Italy but I’m not sure when there wasn’t political turmoil in Italy so maybe that was just a convenient scapegoat. Whatever the cause, investors have taken back some of the optimism they had built into the bond market. Yields are back in the old range and the uptrend in yields is looking tired. I am left wondering if the recent surge in yields was more a last hurrah for this expansion rather than the vanguard of a new era of higher growth. |
US Treasuries(see more posts on U.S. Treasuries, ) |
Economic ReportsEconomic Growth & InvestmentThe Chicago Fed National Activity Index continues to point to slightly above trend growth. The 3 month average is now 0.46 which seems to equate to about 2.7% GDP growth compared to the 2.1% annual growth rate we’ve seen since Q1 2012. First quarter GDP this year was 2.8% so right in line with that estimate. Real final sales growth also confirms the trend at the same rate of year over year growth. Probably the most surprising reading from Q1 GDP was corporate profits. While S&P 500 earnings have been on a tear (up 19% yoy in Q1) that does not translate to the economy as a whole. Indeed, pre-tax corporate profits in Q1 were down 6% from the previous year. Even after tax reform, corporate earnings were barely higher than a year ago. Why aren’t companies investing in their business? I think the answer is pretty obvious. Personal income growth continues to track at a fairly low level even compared to earlier in this cycle. At less than 4% year over year income growth is lower than at the start of the last recession. And the one before that. And the one before that. I can keep doing that but what’s the point? The most optimistic observation I can make is that the year over year rate of growth is better today than the 1.5% it hit in late 2016. With rising gas prices driving consumption growth higher (see below), the difference came from savings where the rate is now less than 3%. |
|
ProductionThese anecdotal, sentiment type surveys show a booming economy that just refuses to show up in the actual economic statistics. All the reports since the last update were better than expected with big rises in new orders and backlog orders. As I’ve said many times, I don’t put a lot of stock in these for calling tops in the economy. They are much more useful at bottoms. |
|
Consumption & DistributionConsumer spending was reported as better than expected but a big portion of that was due to rising gas prices. Overall, the consumption trend hasn’t changed much in a long time. It is positive but continues to track well below the rates of change we’ve seen in past expansions. The current year over year rate of change is near the highs for this cycle – which are near the lows of the last two cycles (which weren’t great either). |
|
OrdersThe headline number for durable goods was distorted by the big drop in aircraft (Boeing) orders. Unfortunately, the ex-transportation number was also distorted – by the steel and aluminum tariffs – making analysis particularly difficult. Core capital goods orders were higher but the previous month was revised down significantly. Overall, I would just observe that the year over year rate of change appears to have peaked for this entire series. |
|
TradeBoth imports and exports of goods were reported down from the previous month. For exports it was vehicles and capital goods; for imports the culprit was consumer goods. How much is the trade war rhetoric – and reality now – affecting trade? |
 |
InflationFor all the articles I’ve seen recently fretting about emerging inflation, I still don’t really see it in the actual economic reports. Yes, inflation has definitely come off the lows seen in early 2016 but it does not appear to be a problem – yet. I suppose it could become one but that would probably require the dollar to resume its fall. That isn’t out of the question and I actually think it is likely but it hasn’t happened yet and may not. Even house prices are starting to moderate, although the year over year change is still way too high in my opinion. |
|
EmploymentThe employment situation has not changed significantly although the rhetoric around it surely has. Neil Irwin, writing in the New York Times last week, said that he had exhausted his thesaurus trying to find synonyms for “good”. Irwin isn’t the knee jerk anti-Republican voice you normally hear at the NYT but he’s surely no cheerleader for Trump either. I can only conclude that he has caught some kind of fever being spread via social media. The numbers were fine but they did not deserve the over the top reception they received. Job growth was a little better than expected but the growth rate trend is still down. Average hourly earnings were slightly better than expected too but year over year up just 2.7%. The workweek was unchanged too so I just don’t see anything to get excited about. The jobs market, for this point in the business cycle, is pretty good if you just take it at face value. Could it be better? Of course it could and we’ve covered that extensively. But it isn’t awful and it certainly isn’t outright negative. It also doesn’t require a new thesaurus. This cycle will probably play out like all the others we’ve seen. The jobs market will gradually deteriorate until it turns negative and we get a recession. When? I don’t know and neither does anyone else but the data and the markets say not right now. Don’t get caught up in the month to month numbers; they’re going to get revised anyway. |
Employment |
ConstructionConstruction spending improved on a rebound in multi-family spending while single family was flat. Home improvement also rose but non-residential spending was decidedly mixed. The year over year change has improved considerably although that is as much due to the low levels of activity last year as any big acceleration. Still it is a positive. New home sales were less than expected but the trend is still higher. It has been a very slow, steady recovery in new home sales over the last few years but the trend is definitely higher. The industry may be running into pricing problems though; the median price in the latest report was down 6.9% and inventory rose to 5.4 months, a stark contrast with the existing home market. |
|
SentimentBoth consumer sentiment and consumer confidence were reported slightly less than expected but the levels are fine. I don’t pay a lot of attention to these readings because they give you no clue about the future; they are coincident indicators at best and are never better than they are right before recession. So, yes, consumers seem confident but they aren’t spending at a high rate, their revolving credit balances are growing and their savings rate is falling. One wonders what exactly makes them so confident. |
|
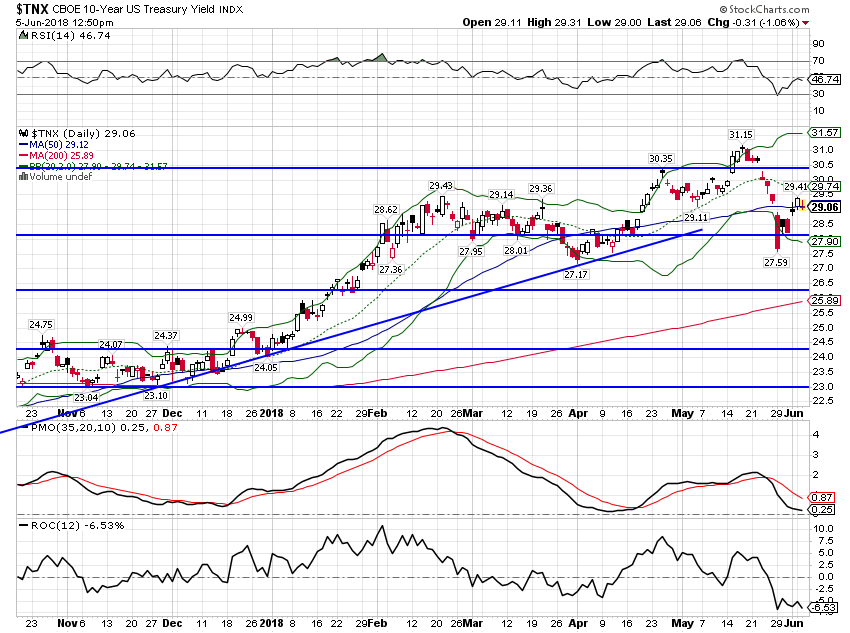
Market Indicators10-Year Treasury Note YieldOver the course of 7 trading days the 10 year yield dropped 36 basis points, a huge move predicated on…Italy I guess but that has already faded as a bogeyman. And it should never have been much of a worry in any case in my opinion, but my opinion doesn’t matter all that much and when people panic they buy Treasuries. It isn’t as if a big rally wasn’t expected at some point. In my last update I said we’d get a big rally no one was expecting because speculators were all lined up on the short side of the market. What is most interesting about this move though is that the short position in Treasury futures actually increased despite this big rally. In other words, there is still a big rally out there somewhere to clear the crowded trade. No matter what kicked off the move it caused the market to mark down growth, inflation and Fed expectations. That would seem to be more a matter of global growth slowing rather than the US specifically. Having said that, I don’t really see much change in the trajectory of the European economy and emerging markets are a known risk. The key variable, as it has been for some time, is the dollar. More on that below. |
US Treasuries, Daily(see more posts on U.S. Treasuries, ) |
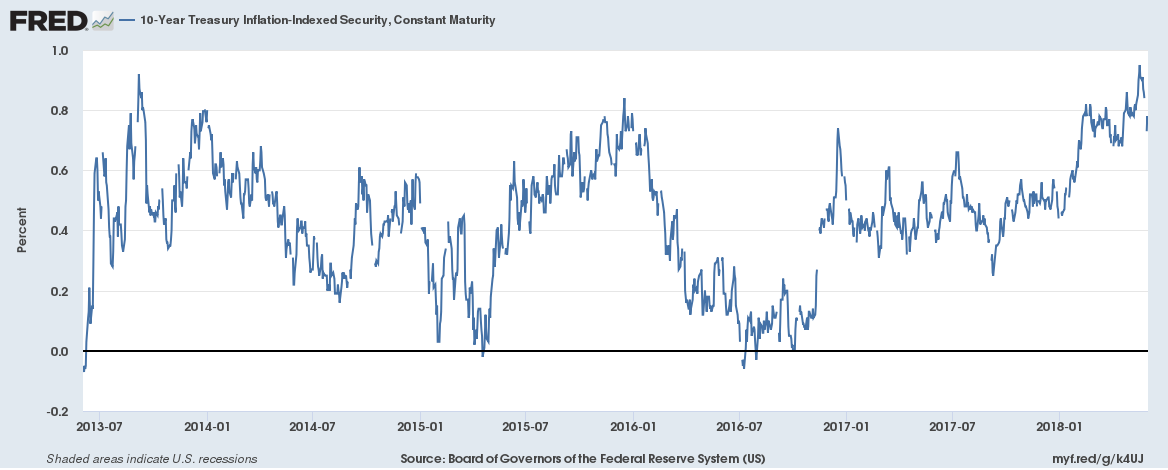
10-Year TIPS YieldAs I said, expectations changed across the board and TIPS were no exception. The 10 year TIPS yield fell 22 basis points over the same time frame so the majority of the drop in nominal rates was about reduced real growth expectations. I wondered last week whether real growth expectations were breaking out and at least for now the answer is no. There is a nice uptrend since mid-2016 though and that is still intact. For now, this and the CFNAI both seem to point to a continuation of slightly above trend growth. |
10-Year TIPS Yield, Jul 2013 - 2018 |
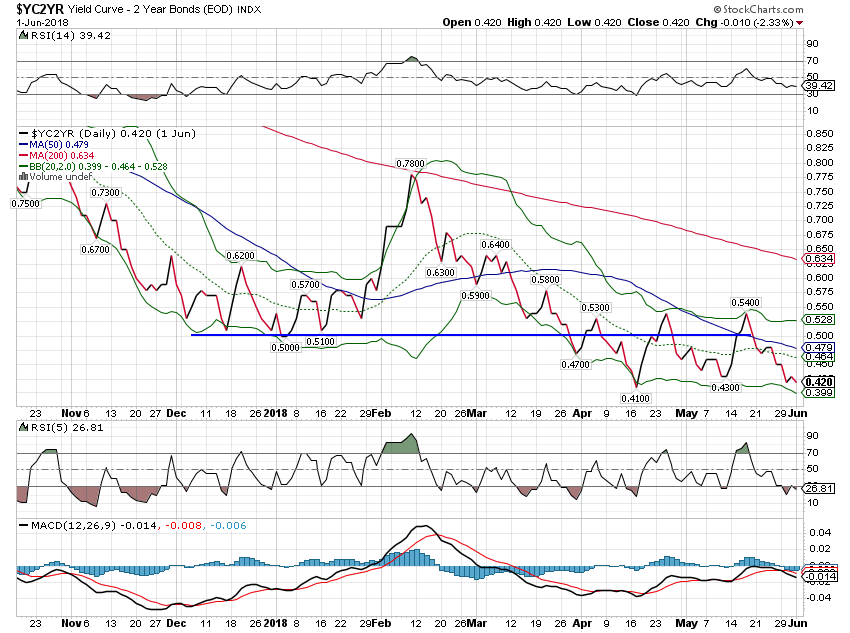
2-Year Treasury YieldThe 2 year yield came off the boil too, which would seem to indicate some new uncertainty regarding future Fed rate hikes. Market participants seem to think the Fed may hold off on more rate hikes until Italy gets its act together. That could be a long wait. Frankly, I think the Fed’s balance sheet shrinkage is the more important factor for foreign economies. If the Fed continues to shrink the balance sheet and constrain dollar liquidity, there will be an accident somewhere. As there always is…. |
2-Year Treasury Yield, Daily |
10/2 Yield CurveThe yield curve is back to the lows of the cycle but we’ve still got 42 basis points to flat. Even when we get there, if history is a guide, recession won’t be imminent. In the last cycle the curve first inverted in February of 2006, almost two years before the onset of recession. |
10/2 Yield Curve, Daily |
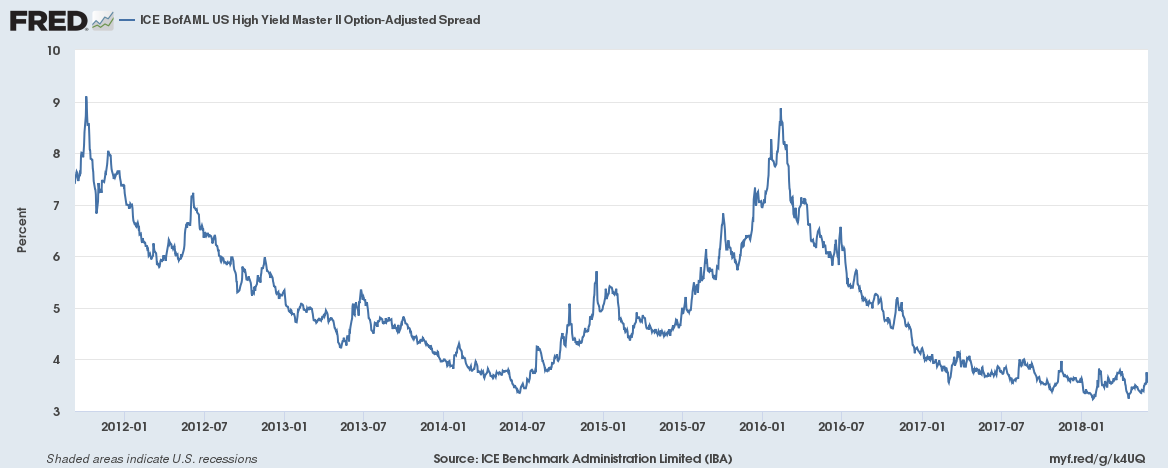
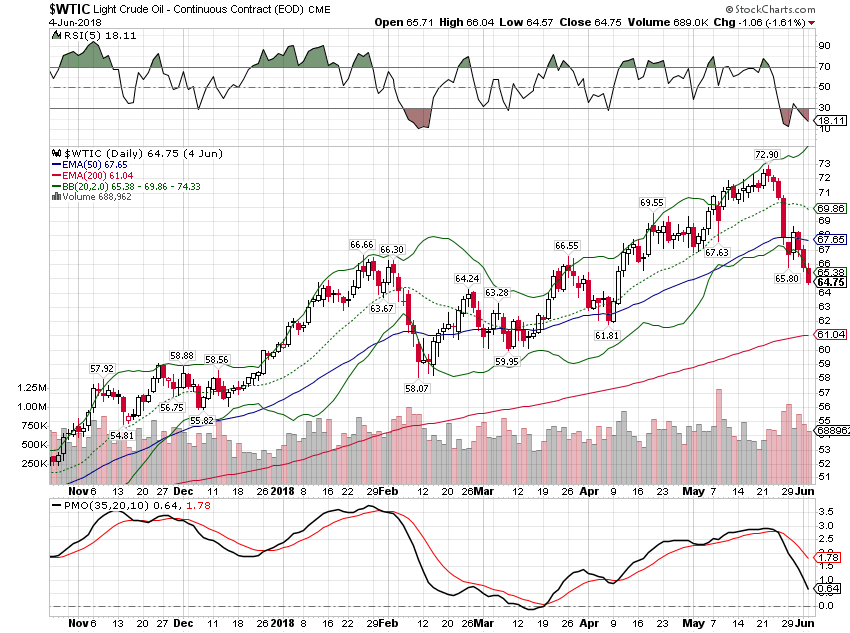
Credit SpreadsCredit spreads also widened during the bond meltup/down but the cause may have been different. It probably isn’t coincidence that spreads widened as crude oil fell. The shale industry is in better shape than it was in the 2014-16 widening phase but not by much. You can still connect spreads to bonds through the dollar which was in rally mode as all this went down. |
Credit Spreads, Jan 2012 - May 2018 |
Light Crude Oil, Daily |
|
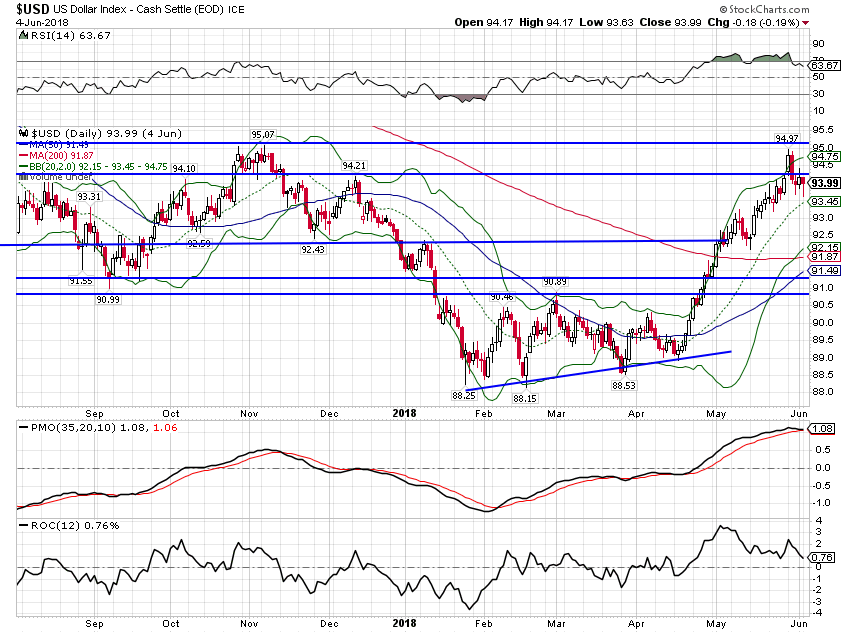
US DollarThe dollar rally carried somewhat higher than I thought it would but still nothing out of the ordinary from a technical standpoint. Short term momentum is now rolling over and long term momentum never turned positive. It isn’t out of the question that the dollar might continue to rally but I think there is a natural self-limiting nature to the rally. As the dollar moves higher a number of negative growth factors start to emerge. Most obvious is that emerging markets suffer severely as capital inflows turn to outflows. We’ve already seen a bit of that and the results aren’t pretty. Another more direct negative is the impact on oil prices and the shale industry. As I’ve been saying for some time now, US economic growth has become highly sensitive to oil prices. If the dollar continues to rally and oil continues to fall, all that positive manufacturing data out of Texas and the midwest is going to turn south. In the 2014-16 episode we came perilously close to recession. |
US Dollar Index, July 2017 - June 2018(see more posts on U.S. Dollar Index, ) |
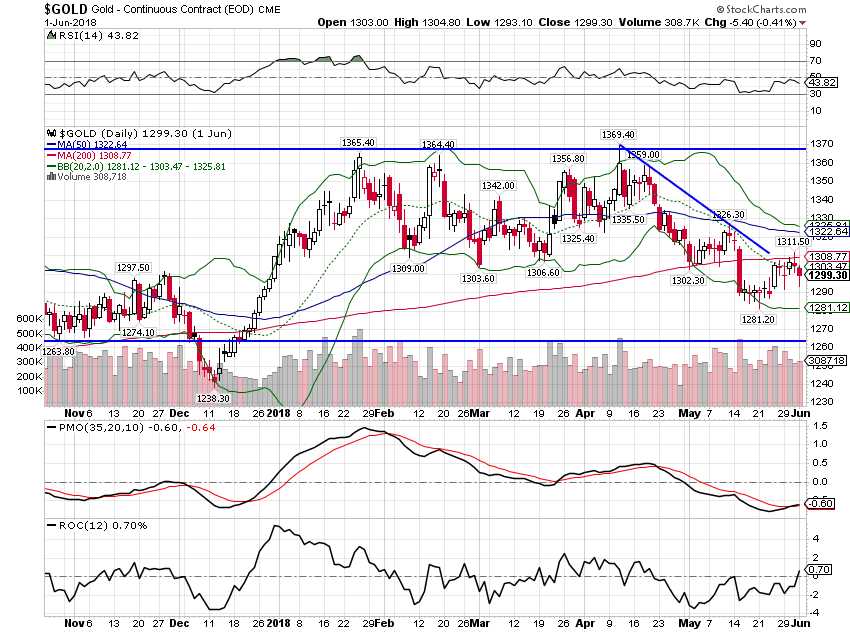
CommoditiesGold is up slightly since the last update. Gold has held up well given the move up in the dollar. |
Gold Price, daily(see more posts on gold price, ) |
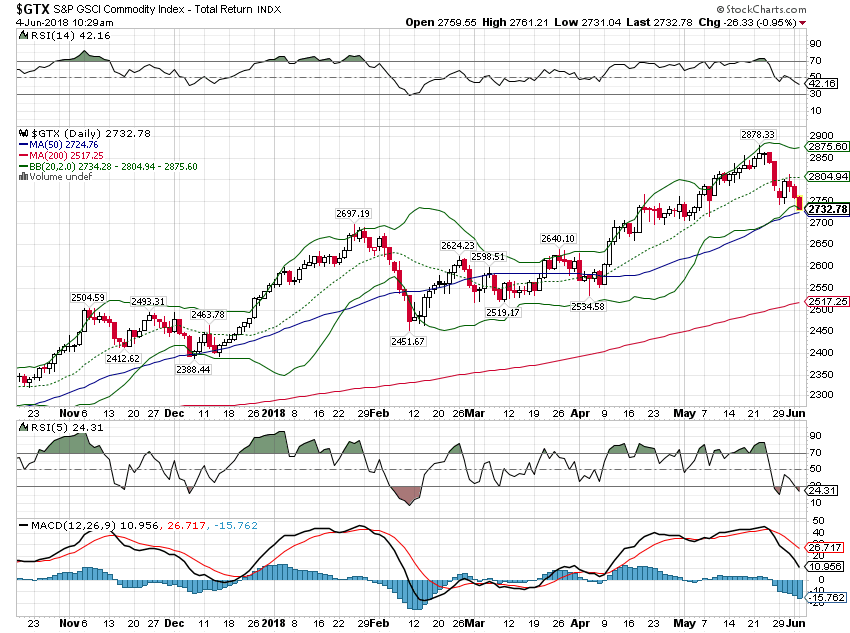
| The GSCI commodity index fell since the last update in concert with oil prices. The GSCI is heavily weighted to energy. |
GSCI Commodity Index, Daily |
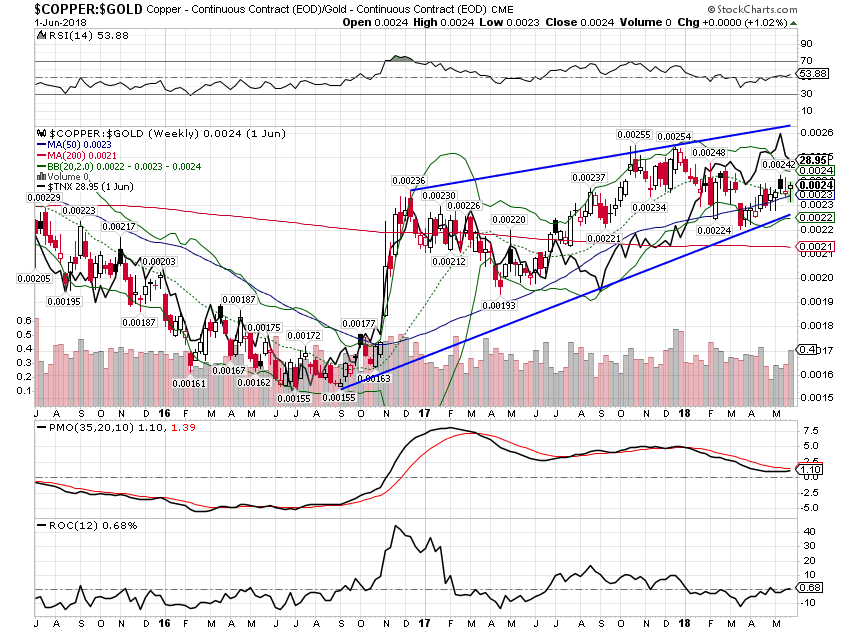
| Despite the pullback in Treasury yields – nominal and real – the copper to gold ratio is still in a short term uptrend. However, the ratio is also no higher today than it was at the beginning of 2017 or 2018 for that matter. This would seem to support the status quo of slightly faster than trend growth. |
Copper:Gold Ratio |
The economic data and our market indicators continue to point to growth that is slightly above trend. For investors that may not be a bad outcome for the short term but as a nation we should hope to do better. The enthusiasm surrounding last year’s tax reform raised expectations for growth. That enthusiasm – animal spirits one might say – can itself have a positive impact on growth but it isn’t magic and can’t get the job done alone. I suspect the reason growth is slightly above trend is because of the change in sentiment we’ve seen since the election. But at some point those growth expectations need to be realized or sentiment will start to shift in the opposite direction. And just as positive sentiment can bouy an economy, so can negative sentiment sink it.
For now, I see no reason to expect anything beyond the status quo of decent but not spectacular growth. I hope that proves conservative but for now that is what the market tells us. We aren’t near recession and we certainly aren’t in a boom. The yield curve isn’t flat or inverted and short term yields are still rising if at a slightly less frantic rate. Credit spreads are well behaved and the dollar may be peaking.
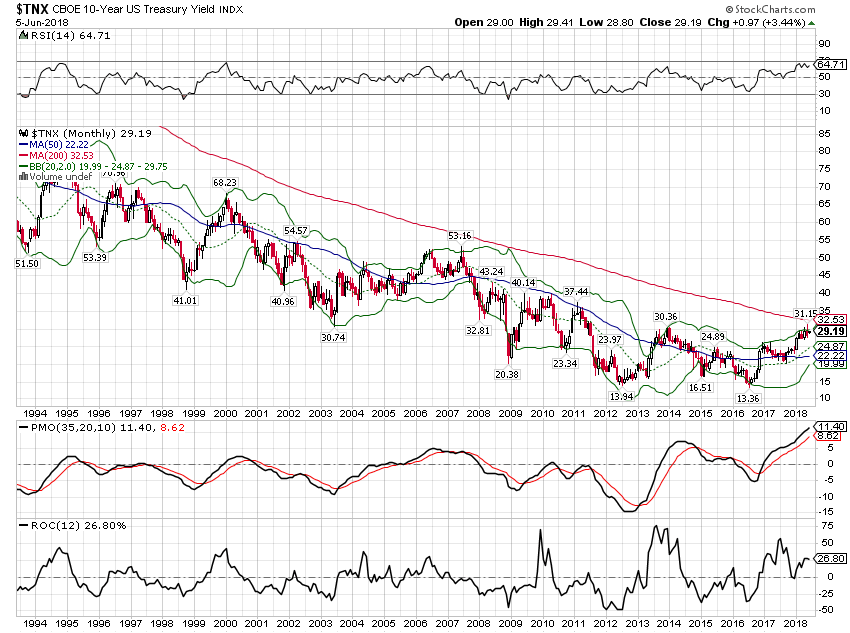
Have rates peaked for this cycle? Looking at that long term chart of the 10 year yield at the top of this report makes me wonder. With the New York Times running out of superlatives to describe the employment report this might well be as good as it gets.
Tags: Bi-Weekly Economic Review,Bonds,cfnai,commodities,consumer spending,copper/gold ratio,credit spreads,Crude Oil,currencies,economy,employment,Featured,Federal Reserve/Monetary Policy,Gold,inflation,Interest rates,Markets,newsletter,Personal Income,Savings Rate,sentiment,Taxes/Fiscal Policy,TIPS,Trade,treasuries,US dollar,Yield Curve

