Meandering Prices Prices rise and prices fall. So, too, they fall and rise. This is how the supply and demand sweet spot is continually discovered – and rediscovered. When supply exceeds demand for a good or service, prices fall. Conversely, when demand exceeds supply, prices rise. Supply and DemandSupply and demand (the curves usually shown in such charts are unrealistic, as bids and offers in the market are arranged in discrete steps). - Click to enlarge Producers use the information communicated by changing prices to make business decisions. High demand and rising prices inform them to increase output. Excess supply and falling prices inform them to taper back production. This, in basic terms, is how
Topics:
MN Gordon considers the following as important: 6) Gold,Bitcoin,Austrian Economics, commodities, Featured, newsletter, On Politics
This could be interesting, too:
Nachrichten Ticker - www.finanzen.ch writes Die Performance der Kryptowährungen in KW 9: Das hat sich bei Bitcoin, Ether & Co. getan
Nachrichten Ticker - www.finanzen.ch writes Wer verbirgt sich hinter der Ethereum-Technologie?
Martin Hartmann writes Eine Analyse nach den Lehren von Milton Friedman
Marc Chandler writes March 2025 Monthly
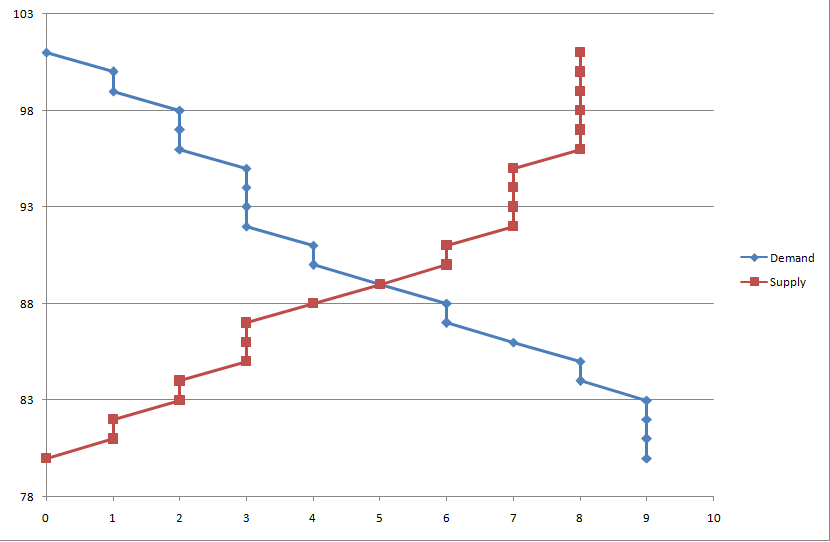
Meandering PricesPrices rise and prices fall. So, too, they fall and rise. This is how the supply and demand sweet spot is continually discovered – and rediscovered. When supply exceeds demand for a good or service, prices fall. Conversely, when demand exceeds supply, prices rise. |
Supply and Demand |
| Producers use the information communicated by changing prices to make business decisions. High demand and rising prices inform them to increase output. Excess supply and falling prices inform them to taper back production.
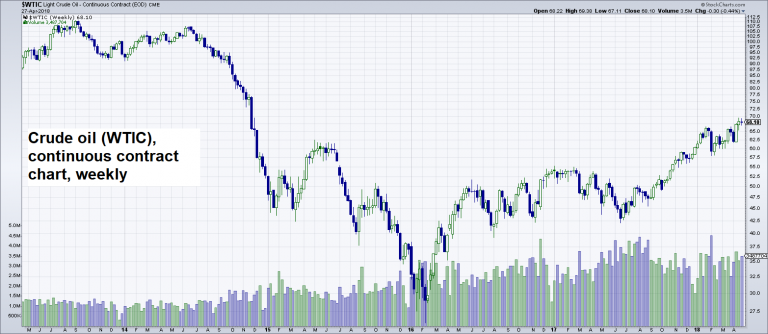
This, in basic terms, is how markets work to efficiently bring products and services to market. Five year plans, command and control pricing systems, and government price edicts cannot hold a candle to open market pricing. But not all markets are created equal. The market for gumballs or garbage bags, for instance, is much simpler than the market for solar panels or jet engines. What we mean is some markets are subject to more government intervention than others; especially, if there’s a large money stream that can be extracted by government coercion. Sometimes governments nationalize an entire market – for the good of the people, of course. Strange and peculiar price movements can indicate there’s something else besides natural supply and demand mechanics going on. On April 6, a barrel of West Texas Intermediate (WTI) grade crude oil cost about $62. Ten months ago, that same barrel of WTI oil cost about $43. About 24 months ago, it was only about $30 a barrel. Yesterday, April 26, WTI oil was about $68 a barrel. What’s going on? |
Crude Oil, May 2013 - Apr 2018A large share of global oil production is performed by government-owned entities. This may explain why oil is pretty much the only major commodity that is not in a persistent downtrend against real money (i.e., gold) over the past 70 years or so, but is instead going sideways in a fairly broad channel. It is astonishing that despite the inefficiency attending such a large share of oil production most types of “alternative energy” production are still not economically viable without government subsidies! |
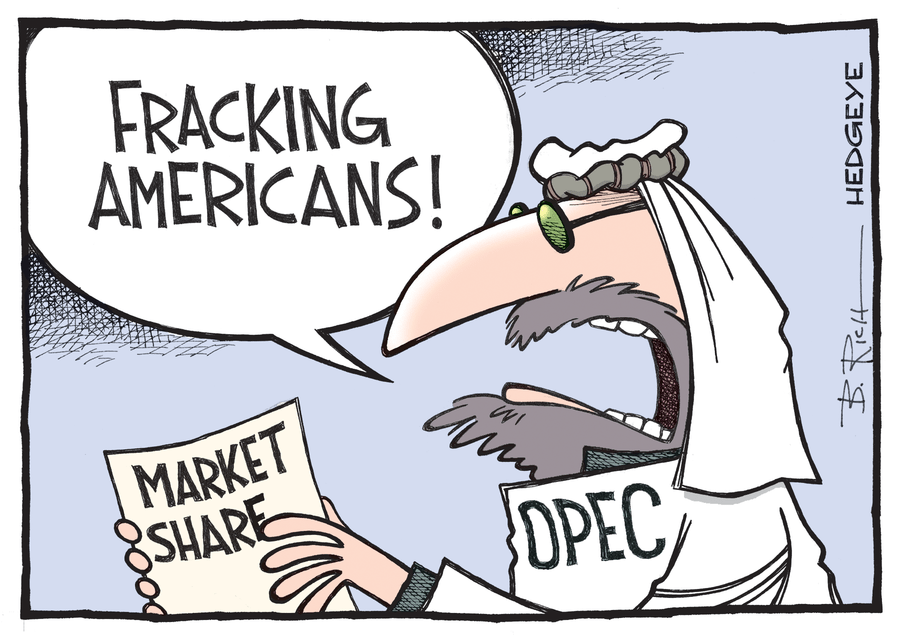
Price Fixing AccidentsIndeed, the oil market is subject to mass government interventions the world over. The push and pull of these hindrances to regular market determined price discovery can prompt wild price distortions. We don’t pretend to understand the many variables at play that influence the price of oil. Still, today, we scratch for clarity and edification, nonetheless. To begin, the oil and gas business is notoriously cyclical. Oil investors have wild swings in production and consumption to contend with. But what makes it an especially difficult market is the extreme intervention by the Organization of Petroleum Exporting Countries (OPEC) – a 14 nation cartel, which often works in concert with Russia – for the purpose of fixing the price of oil to their liking. Part of the reason the oil price collapse was so severe in 2015 is that OPEC ramped up its production. From what we gather, this was done with the direct intent of yanking the rug out from under U.S. shale oil producers. |
|
| Back then, OPEC members could profitably produce oil at a cheaper price than U.S. shale oil producers. Thus OPEC’s logic was to bankrupt U.S. shale producers and put them out of business so it could maintain its strangle hold on world oil markets. OPEC’s play may have been successful, initially. They certainly exacted maximum pain on U.S. shale producers. Though, by accident, they also exacted maximum pain on certain member countries.
The consequences were most obvious for OPEC member Venezuela. Lower oil prices not only bankrupted U.S. shale oil producers. They also bankrupted Venezuela, whose socialist utopia collapsed under a declining stream of oil revenues. What’s more, the societal collapse also damaged Venezuela’s ability to operate its oil industry, resulting in a massive decline in rates of production. Debt, lack of maintenance, a lack of cash to invest, and a brain drain of Venezuela’s best and brightest engineers are all contributing to the steep decline. And while the consequences of OPEC’s decision to collapse the price of oil, and bankrupt U.S. shale producers, were most apparent in Venezuela, they also put a big pinch on other OPEC countries, which are highly dependent on oil revenues. That’s why at the end of 2016, OPEC members and Russia entered into an agreement to cut production and allow the price of oil to rise. |
|
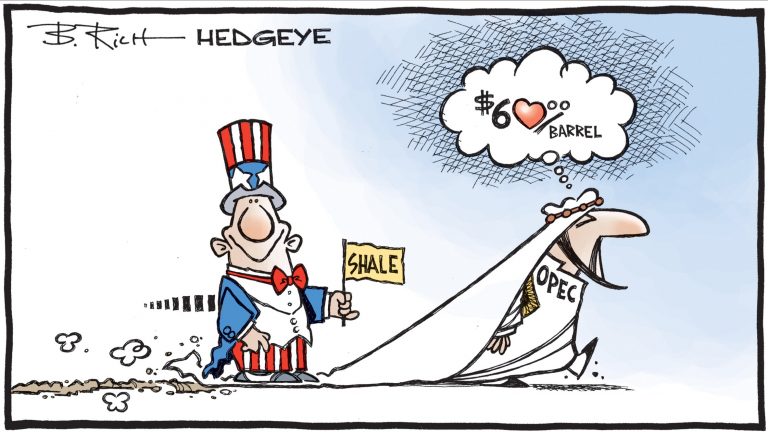
The Oil Curse Comes to WashingtonOPEC and Russia may have made a grave miscalculation. Their price fixing scheme has produced another accident. The price of oil has risen too far and too fast for their liking. At the beginning of the New Year 2018, the price of oil had eclipsed $60 per barrel. Presently, the price of oil’s a horse’s hair shy of $70 per barrel. This higher price of oil, thanks to OPEC’s and Russia’s efforts to fix the oil market, has had the effect of handing U.S. shale producers a golden ticket. Above $50 per barrel, U.S. shale producers can produce shale oil at a breakeven price. At over $65 per barrel, they’re making a solid profit. |
|
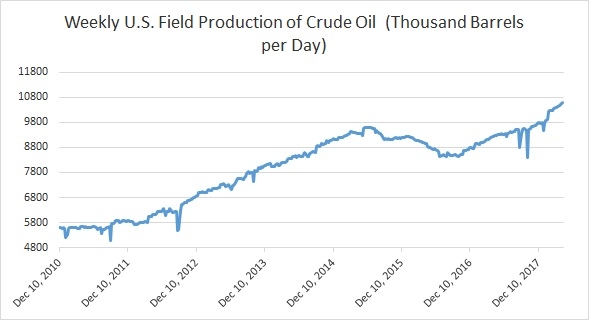
| Furthermore, with oil prices reaching these profitable production levels, U.S. shale oil producers have locked in these prices, via hedging, under long term future’s market contracts. With these hedges in place, U.S. shale oil companies have ramped up production, surpassing 10 million barrels per day for the first time since 1970. Naturally, OPEC and Russia are looking to put an early termination to their oil production cut deal.
But with U.S. shale companies having locked in a profitable price for delivering oil to market, the cartel may have lost its control over global oil prices. In the long term, they sealed their fate. U.S. crude output is on track to surpass Saudi Arabia this year and rival Russia, the world’s top oil producer, in the not too distant future. Already, U.S. oil exports are growing by leaps and bounds. In fact, last week, the U.S. averaged 2.3 million barrels per day in crude oil exports. This is the highest average for U.S. oil exports, for any week on record. This all sounds great for the U.S., we know, but what are the implications? Will being the world’s top oil producer be a blessing or a curse for the U.S.? Many other oil rich nations have found large oil discoveries and strong production to be a curse. The nation quickly becomes dependent on abundant oil revenues, and government corruption and chaos follow. Certainly, the U.S. economy’s large enough the bump from increased oil production won’t be all encompassing. Still, we suspect the U.S. government won’t be able to handle it. |
Weekly US Field Production of Crude Oil, Dec 2010 - Apr 2018 |
Will Washington use its cut of the new shale oil wealth to pay down debts? Will they use it as a bridge to cover unfunded liabilities, while executing a long-term plan to reduce the number of government dependents?
Or will the U.S. government use it as an impetus to ramp up spending, go deeper in debt, and further push its reach and influence the world over? Alas, Washington’s actions over the last century have already bellowed the answer.
Charts by: Vanguard Business School, StockCharts, EconoTimes
Chart and image captions by PT
Tags: commodities,Featured,newsletter,On Politics

