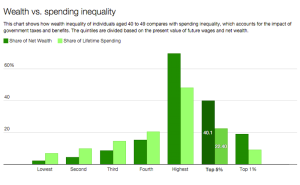
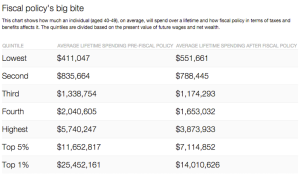
In a New Republic blog, Alan Auerbach and Larry Kotlikoff discuss lifetime spending inequality. Due to taxes and income variability over the life cycle, this is much smaller than wealth or income inequality. Auerbach and Kotlikoff write: The top 1 percent of 40-49 year-olds face a net tax, on average, of 45 percent. … For the bottom 20 percent, the average net tax rate is negative 34.2 percent. … Our standard means of judging whether a household is rich or poor is based on current income. But this classification can produce huge mistakes. … For example, only 68.2 percent of 40-49 year-olds who are actually in the third resource quintile using our data would be so classified based on current income.
Topics:
Dirk Niepelt considers the following as important: inequality, Lifetime income, Notes, Redistribution, Spending inequality, United States, Wealth inequality
This could be interesting, too:
Dirk Niepelt writes Does the US Administration Prohibit the Use of Reserves?
Dirk Niepelt writes “Report by the Parliamentary Investigation Committee on the Conduct of the Authorities in the Context of the Emergency Takeover of Credit Suisse”
Dirk Niepelt writes “Governments are bigger than ever. They are also more useless”
Dirk Niepelt writes The New Keynesian Model and Reality
In a New Republic blog, Alan Auerbach and Larry Kotlikoff discuss lifetime spending inequality. Due to taxes and income variability over the life cycle, this is much smaller than wealth or income inequality.
Auerbach and Kotlikoff write:
The top 1 percent of 40-49 year-olds face a net tax, on average, of 45 percent. … For the bottom 20 percent, the average net tax rate is negative 34.2 percent. …
Our standard means of judging whether a household is rich or poor is based on current income. But this classification can produce huge mistakes. … For example, only 68.2 percent of 40-49 year-olds who are actually in the third resource quintile using our data would be so classified based on current income.


