In the AEJ: Economic Policy, Christopher Hoy and Franziska Mager report that people are less supportive of redistribution when they learn that they are poorer than they thought. We test a key assumption underlying seminal theories about preferences for redistribution, which is that relatively poor people should be the most in favor of redistribution. … people who are told they are relatively poorer than they thought are less concerned about inequality and are not more supportive of...
Read More »Income Tax Burdens in Switzerland
In the NZZ, Hansueli Schöchli summarizes recent evidence. Wer in der Schweiz im Jahr 2017 wie viel Einkommenssteuer bezahlte Anteil Steuerpflichtige (in Prozent) Anzahl Steuerpflichtige Minimales Reineinkommen in Fr. Durchschnittliche Steuerbelastung (in %) Anteil der Einkommenssteuer Bund/Kanton/Gemeinde (in %) 0,01 515 4 548 020 43,8 4,82 0,1 5 150 1 109 760 37,3 9,89 1 51 498 331 731 34,4 24,04 5 257 489 152 799 28,1 42,55 10 514 978 111 403 24,6 53,03 25 1 287 444 73 769...
Read More »“Wirtschaftspolitik angesichts von Covid-19: Lastenteilung, aber keine Preismanipulationen (Economic Policy Responses to Covid-19: Burden Sharing, But no Price Distortions),” ÖS, 2020
Ökonomenstimme, 3 April 2020. HTML. Shorter version published in NZZ. The aggregate Covid-19 shock calls for transfers of the type a pandemic insurance would have brought about. But we must not distort relative prices. They have to reflect scarcity, to provide incentives to overcome it. (This applies within countries but also across.)
Read More »“Preise müssen sich frei bilden können (Prices Must Reflect Scarcity),” NZZ, 2020
NZZ, 2 April 2020. PDF. The aggregate Covid-19 shock calls for transfers of the type a pandemic insurance would have brought about. But we must not distort relative prices. They have to reflect scarcity, to provide incentives to overcome it. (This applies within countries but also across.)
Read More »AXA Stops `Vollversicherung’ Model
In the NZZ, Werner Enz reports that the insurance company AXA will stop offering “Vollversicherungen.” One motivation relates to the fact that the second pillar in the Swiss pension system is increasingly abused, with redistribution undermining supposedly “individual” accounts.
Read More »Redistribution at the EU Level
On VoxEU, Paolo Pasimeni and Stéphanie Riso argue that at the EU level, cross-border redistribution is limited: The EU budget accounts for roughly 1% of the EU’s GDP. Around 80% of it, on average, returns back to each country in the form of various allocated expenditures, and only a limited part is actually redistributed among countries. On average over the past 15 years, the redistribution operated by the budget at the level of the EU was equal to 0.2% of the Union’s GDP. As a matter of...
Read More »Redistribution From Unexpected Deflation in the Euro Area
In the JEEA 14(4) (August 2016) Klaus Adam and Junyi Zhu argue that unexpected price-level movements generate sizable wealth redistribution in the Euro Area (EA) … The EA as a whole is a net loser of unexpected price-level decreases, with Italy, Greece, Portugal, and Spain losing most in per capita terms, and Belgium and Malta being net winners. Governments are net losers of deflation, while the household (HH) sector is a net winner … HHs in Belgium, Ireland, Malta, and Germany experience...
Read More »Deposit Insurance: Economics and Politics
On VoxEU, Charles Calomiris and Matthew Jaremski discuss the origins of bank liability insurance. They argue that it is redistribution, not the aim to boost efficiency, which explains a lot of the action. … there are two theoretical approaches to explaining the creation and expansion of deposit insurance. The first is an economic approach grounded in potential efficiency gains from limiting bank runs (i.e. the public interest motivation). The second is a political approach grounded in the...
Read More »Spending Inequality
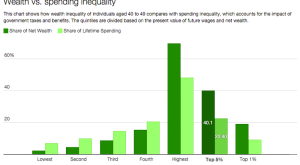
In a New Republic blog, Alan Auerbach and Larry Kotlikoff discuss lifetime spending inequality. Due to taxes and income variability over the life cycle, this is much smaller than wealth or income inequality. Auerbach and Kotlikoff write: The top 1 percent of 40-49 year-olds face a net tax, on average, of 45 percent. … For the bottom 20 percent, the average net tax rate is negative 34.2 percent. … Our standard means of judging whether a household is rich or poor is based on current income....
Read More » Swiss Economicblogs.org

