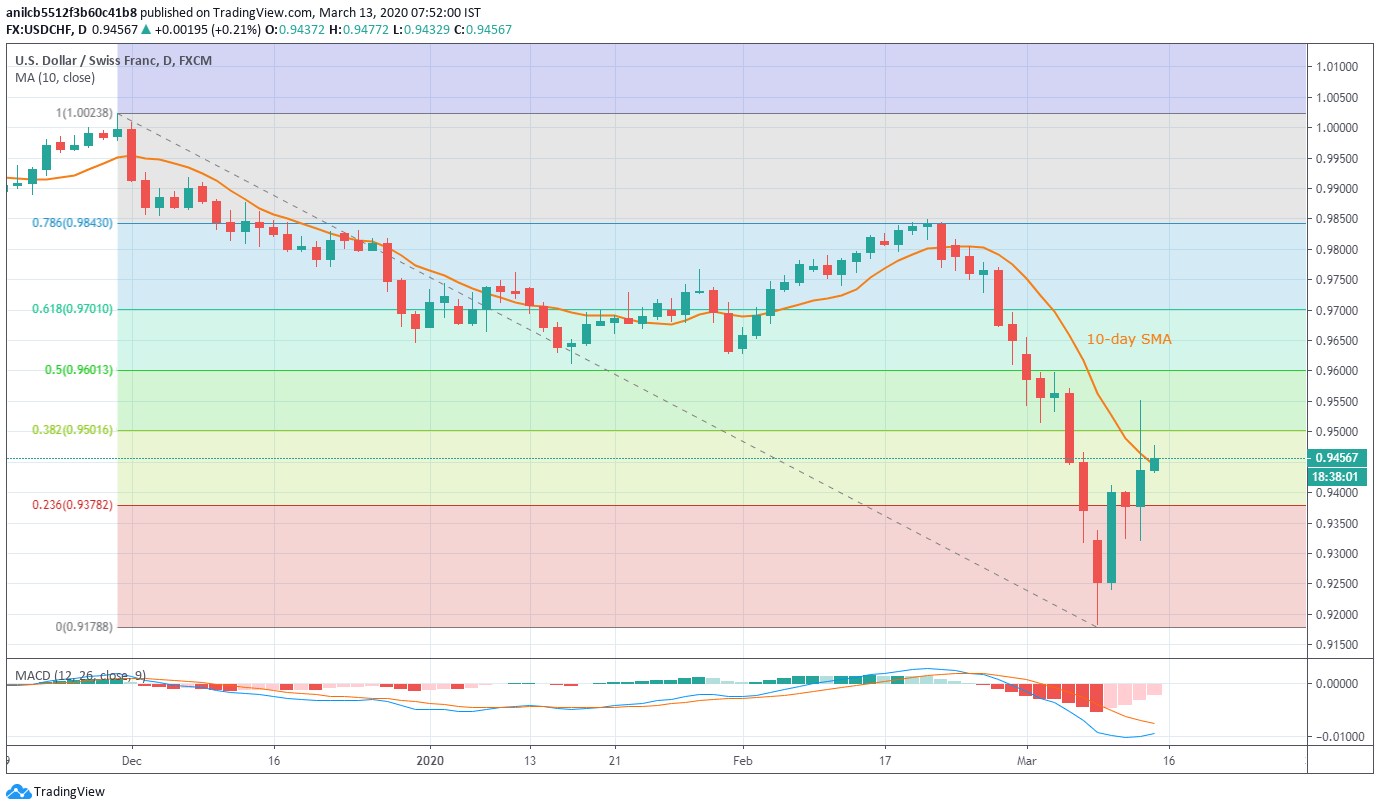
USD/CHF holds onto recovery gains from 23.6% Fibonacci retracement level. 50% of Fibonacci retracement, January month low on the bulls’ radars. Sellers can take entry below 0.9320. USD/CHF adds 0.22% to its previous recovery, currently crossing 10-day SMA, while trading near 0.9460 during the early Friday. The pair manages to remain positive beyond 23.6% Fibonacci retracement of its fall from November 2019. As a result, buyers can aim for further upside beyond a 38.2% Fibonacci retracement level of 0.9500. In doing so, 50% of Fibonacci retracement and January month’s low, respectively near 0.9600 and 0.9615, can please the bulls. During the pullback, 0.9320 can act as additional support below the 23.6% Fibonacci retracement level of 0.9378. However, a daily
Topics:
Anil Panchal considers the following as important: 1) SNB and CHF, 1.) FXStreet on SNB&CHF, Featured, newsletter
This could be interesting, too:
Mark Thornton writes The Great Chocolate Crisis of 2024
Mustafa Ekin Turan writes How EU Law Has Made the Internet Less Free for Everyone Else
Thomas J. DiLorenzo writes Attention mises.org Readers! Treat the Students in Your Life to The Best Week of Their Year
Octavio Bermudez writes Mises in Argentina: Lessons of the Past for Today
- USD/CHF holds onto recovery gains from 23.6% Fibonacci retracement level.
- 50% of Fibonacci retracement, January month low on the bulls’ radars.
- Sellers can take entry below 0.9320.
| USD/CHF adds 0.22% to its previous recovery, currently crossing 10-day SMA, while trading near 0.9460 during the early Friday. The pair manages to remain positive beyond 23.6% Fibonacci retracement of its fall from November 2019.
As a result, buyers can aim for further upside beyond a 38.2% Fibonacci retracement level of 0.9500. In doing so, 50% of Fibonacci retracement and January month’s low, respectively near 0.9600 and 0.9615, can please the bulls. During the pullback, 0.9320 can act as additional support below the 23.6% Fibonacci retracement level of 0.9378. However, a daily closing below 0.9320 will make the quote vulnerable to extend the south-run towards 0.9000 mark. |
USD/CHF daily chart(see more posts on USD/CHF, ) |
Trend: Further recovery expected
Tags: Featured,newsletter

