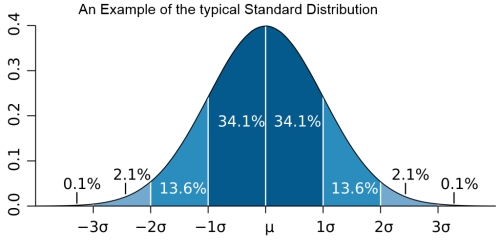
Standard deviation (sigma σ) measures volatility or the dispersion of random values around the mean of a variable such as a portfolio or individual stock prices, but does not measure the direction of a trend. Standard Deviation as volatility measure What has become the bedrock of finance is an out-of-date almost universally accepted finance theory, which uses the statistical normal distribution (the Gaussian bell curve) as the measure of risk per se. In reality stocks are found not to be normally distributed but in gross measure leptokurtic and skewed. As a consequence, price changes do not behave as expected, so that standard deviation can be a very misleading proxy for risk as the following example shows. Two traders with similar standard deviations may show entirely different distributions of return! This is because the volatility attributes of stock prices are not uniformly linear, contrary to that assumed by conventionally accepted financial theory. Therefore one portfolio’s volatility profile may look like the familiar normal distribution; but the other will be shown to have a much greater degree of kurtosis and skewness.
Topics:
John Henry Smith considers the following as important: Alpha premium, Featured, Gauss, Grail Omega Portfolio, Grail Securities, leptokurtic, sharpe ratio, Skewness, trend direction, Value-at-Risk, Volatility
This could be interesting, too:
Nachrichten Ticker - www.finanzen.ch writes Die Performance der Kryptowährungen in KW 9: Das hat sich bei Bitcoin, Ether & Co. getan
Nachrichten Ticker - www.finanzen.ch writes Wer verbirgt sich hinter der Ethereum-Technologie?
Marc Chandler writes March 2025 Monthly
Mark Thornton writes Is Amazon a Union-Busting Leviathan?
Standard deviation (sigma σ) measures volatility or the dispersion of random values around the mean of a variable such as a portfolio or individual stock prices, but does not measure the direction of a trend.
Standard Deviation as volatility measure
What has become the bedrock of finance is an out-of-date almost universally accepted finance theory, which uses the statistical normal distribution (the Gaussian bell curve) as the measure of risk per se.
 In reality stocks are found not to be normally distributed but in gross measure leptokurtic and skewed. As a consequence, price changes do not behave as expected, so that standard deviation can be a very misleading proxy for risk as the following example shows.
Two traders with similar standard deviations may show entirely different distributions of return! This is because the volatility attributes of stock prices are not uniformly linear, contrary to that assumed by conventionally accepted financial theory. Therefore one portfolio’s volatility profile may look like the familiar normal distribution; but the other will be shown to have a much greater degree of kurtosis and skewness.
This false premise of linearity degrades the industry’s range of standard risk metrics, not just of standard deviation, but also of beta, the Capital Asset Pricing Model, the Sharpe ratio and R-Squared, all based on the perfectly formed theoretical bell curve. This is because asymmetric price distributions affect the outcomes of risk metrics.
The consequence of these misinterpretations is that they have led to sub-optimal strategies such as index investing in the mistaken hypothesis that they are less risky by offering little more than the market risk premium. However, in times of low-return markets as we currently experiencing losses quickly mount up compared to those strategies which seek profit maximization.
The Significance of Skewness
In probability theory and statistics, skewness also measures the asymmetry of a distribution. The skewness of a portfolio may be either positive or negative. Positive skew means that there is a higher probability of a significant return. This is because it measures the direction of surprises and resulting trends that create gains or losses in addition to the market risk premium. Outliers, or extremes in performance, not associated with normal distributions, will clearly demonstrate skewness. The crash of 1987, which was the largest one-day stock market crash in history, was such an extreme outlier. On the other hand, a positive outlier will stretch the right hand tail of a distribution.
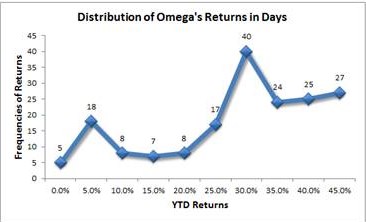
The following chart per 21 September shows the asymmetric distribution of the Grail Omega Portfolio, which was set up on 31 December 2014 and has the shape of a double leptokurtic distribution at the 5% and 30% points with a positive skew of 33% and a negative one of 67%.

Return Distribution of the Grail Omega portfolio
Volatility and Value-at-Risk
Using standard deviation, Value-at-Risk attempts to quantify how much loss a portfolio may suffer with a given probability. This metric calculates semi-standard deviations to separate upside from downside volatility. As such VaR is not just the measure of the risk of loss, i.e. short volatility, but also of the ‘risk’ of gain, i.e. long volatility.
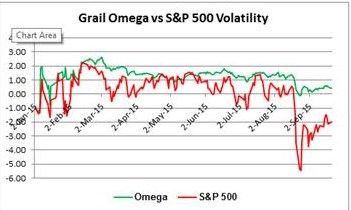
This chart tracks on a daily basis the volatility of the Grail Omega Portfolio and the S&P 500 from the beginning of the year, and shows that the highest risks are certainly with the index.

The Grail Omega portfolio has significantly lower volatility than the S&P500
The Alpha Premium
If a share price is generating an abnormal return, it is likely because the company is reporting strong and consistent revenue and EPS growth, as well as other positive financials. Such a company-specific result, which exceeds the market return, is called the Alpha premium.
This premium has for example the propensity to raise a stock’s beta value during bullish market conditions and to reduce it in bearish environments, and is caused by a stock’s asymmetric price distribution, described above, and not the bell curve of standard financial theory. Additionally, portfolio diversification processes are unlikely to fully dilute the Alpha premium to a mere near-market return, especially when a portfolio holds a concentration of similarly endowed stocks, such as the Grail Portfolio, which is generating these very strong abnormal returns:
Alphas only infrequently influence directly the market return. Usually they originate from large-cap bellwether stocks like Apple (AAPL) when they make major announcements.
The absence of above-average Alphas in funds and portfolios is a greatly missed opportunity, because they unnecessarily harbour higher risks and lower returns.
In the second part John will explain volatility in the phases of a trading cycle, the low volatility anomaly and behavioural aspects that provides explanation.
See more for