Tuesday , March 19 2024
Home / John Henry Smith
John Henry Smith

John Henry Smith

John Henry Smith has British and Swiss citizenship and between 1980 and 2001 held senior management positions in international banks and other financial institutions, including the former International Securities Market Association. Currently he is a member of the board of directors of four Swiss investment corporations and has engaged in management consultancy.

Articles by John Henry Smith

Free portfolio performance 10 Jun 16

June 14, 2016

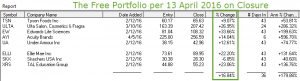
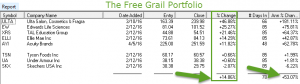
The free portfolio advanced 2.02% this week, but the S&P lost the small amount of 0.12%.
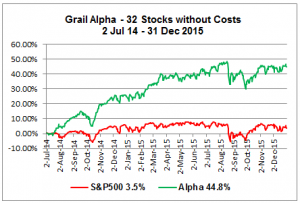
Click to enlarge.
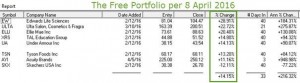
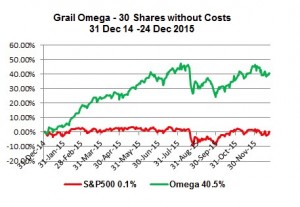
The Ultima Plus portfolio became operational on 31 December 2015.

Click to enlarge.

Market Comment
Up to Wednesday, the S&P 500 rose to a 10-month high of 2119.12 points, less than 1% below its all-time high of 2130.82 of 12 May last year. But stocks pulled back on Thursday and more decisively on Friday, as bond yields around the world reached or neared record lows amid looming gloomy political and economic headwinds.
On the political front, the British newspaper ‘The Independent’ published today a survey that showed that in the last 12 days 55% of voters polled favoured BREXIT, a swing of 10% in just 12 days, while only 44% were in favour of remaining in the EU.
In my email Report of 15 May, I had warned of both of the difficulty of overcoming the ceiling of 2130.82 and the dangerous economic consequences of the BREXIT  ‘leave vote’ winning.
“I would like to add that in my opinion there as lurking Black Swan hiding in all equity markets, which has the name of BREXIT! Describing the uncertainties, Christine Lagarde of the IMF warned that if Britain leaves the European Union the impact would range from “pretty bad to very, very bad.

Read More »

Will the U.S. Stock Market give birth to its own Black Swan?

May 31, 2016

At 2099.06 points the S&P 500 is now in a confirmed uptrend and on the cusp of attacking the 19 April high of 2100.80. If it conquers this pressure point, the index will enter a zone of resistance up to 2126.64 points. This range will certainly be treated by the market with due trepidation, when it returns from the Memorial Day holiday on Tuesday!
According to my stochastics indicator, the market appears to be over-bought and my Grail momentum indicator is swinging a bit to the down-side. A far more interesting factor is shown in the table, because its value coincides with the area of the resistance zone. The S&P 500’s average earnings growth has been steadily declining since 2010 and has lost -15.42% from its peak in that year. It appears to confirm the growth stagnation of the U.S. economy, and could signal an impending correction or even the start of a recessionary trend if other factors feed into the decline. The projected P/E ratio calculated by Standard & Poors is 18.73, which, if correct, would cause the S&P 500 to drop to 1620.71 points, a loss in the index of 22.82% with a 24.6% probability!

S&P 500 average  earnings growth rate
 
S&P 500’s current P/E Ratio
 
S&P 500’s Expected Value
$87.53
x
24.26
=
2123.48
This scenario of course all remains to be seen, but it suggests that a black swan baby in the making, because the estimate also confirms the U.S.

Read More »

Stunning results achieved by Grail’s Free Portfolio in just two Months!

April 18, 2016

I am very pleased to report that the Free Portfolio in its deadline week exceeded my target of 15%, having reached a return of 16.84%, helped by a gain of 2.7%!

The purpose of the portfolio was to give readers irrefutable evidence of the unique power of the Grail Equity Management System (GEMS) to generate high returns with no more risk than the S&P 500.

High Return:
This graph shows that the mother portfolio has a margin of safety vis-à-vis the index of 23.1%,


Low Risk:

The second graph, based on daily measurements of sigma, proves that the portfolio is significantly less volatile than the index! This is because the S&P 500’s daily prices are very close to its average.


I had targeted readers like you to verify the correctness of the portfolio and be convinced that the widely-used bench-marking strategy is by far riskier than GEMS’s strategy of absolute returns generated by high-grade market leaders.
Images of the Abnormal

The question is why should investors not be given the opportunity of such high return portfolios, when it is certain that the cause of under-performance is a deep-rooted, but false, financial theory.

Read More »

The Free Portfolio and the Age of the Alpha Stock

April 13, 2016

This free portfolio is offered to help investors understand that what they may have learnt about risk and return do not correspond to the realities of investing today.

COMMENTS ON THE PORTFOLIO

Unfortunately Sketchers (SKX), which lost more than 12% has not yet bottomed out. There is a theory, which says that the market is always right, but I believe that the market is always wrong. SKX’s data indicates the latter:

Q1 EPS
Forecast

Q2 EPS
Forecast

Current Year
Forecast

Next Year
Forecast

P/E Ratio
PE to Growth
Ratio

43%
14%
37%
20%
16
0.38

The company has an aggressive growth policy to expand internationally, targeting 1650 points-of-sale this year, especially in Europe and China, which will depend of its brand acceptance and the product mix, with Under Amour, and Nike as their main competitors. Although the Year-on-Year EPS growth is declining, the above forecasts indicate an encouraging improvement. If the stock does not beat consensus forecasts on 27 April its price will however take another beating, but if it outperforms, it will breakout into a wholesome intermediate trend. I recommend you see how the stock reports, before you take any (further) position is it.
At 14.15%, the Portfolio’s performance is very close to the 15% set to be achieved in the two months from 12 February, i.e. in just two trading days.

Read More »

Nicolas Darvas: Follow the Price Action and Set Stop-Losses

March 23, 2016

Of the many rules prescribed for investment success, the most golden of all is to cut your losses before they get too big. As this bearish market is teaching us, it is a rule that is always best kept to! The speculator and dancer (!) Nicolas Darvas gave us ideas how to set the stop-loss.

If you read this Newsletter regularly, you will already have appreciated its importance. You may have also witnessed the peaking and catastrophic falls of such market favorites as Weight Watchers (WTW) from 18 November 2015 to 8 February 2016 of -60% and Netflix (NFLX) from 4 December 2015 to 5 February 2016 of -37%. Therefore keeping to the rule of cutting short your losses and letting your profits run immunizes your portfolio against the financial calamity of free falling in good and bad markets.
Remember to set stop-losses
You may well ask at what point you should exit a stock. Why not at the 10% mark or when you are down 15% or at whatever suits your style and temperament or long-term investment horizon. Research has shown that if you buy a leadership-quality stock at the time it breaks-out of a sound support level on strong volume, and the market is in a healthy uptrend, the stock should not fall further than 8%. Smaller fluctuations are considered part and parcel of normal market volatility and therefore you need to take no further action provided that all other things remain equal.

Read More »

How you see the Stock Market determines your Profit or Loss!

March 7, 2016

The key economic note this week was that non-farm payrolls for February was 242,000 versus Wall Street’s expectation of only 190,000; 27% above the consensus target.
Wages however fell back by 0.1% from February’s gain of 0.5%.
The workforce participation rate moved up to 62.9%. The excellent news on Friday was however received mutely by the market.
Excellent news received muted by the market
The reason was the likelihood that it will increase the probability of further interest rate rises by the Federal Reserve Board. In fact, a Reuter’s poll shows that the majority of top US bankers believe that there will be two more this year, causing a switch into money market instruments.
Looking at the broad economic backdrop, China’s five year plan projects, with difficulty, an annual growth rate of 6.5%, the worse forecast in a quarter of a century! The US is expected this year to grow at an anemic annual rate of 2.2%. Also, its trade deficit widened more than expected in January as a strong dollar and weak global demand helped to push exports to a more than five and a half year low! This has increased the trade gap by an addition 2.3% to $45.7 billion, with exports declining for four straight months.

Read More »

The stock market’s siamese twin oiled Friday’s rally

February 16, 2016

Dear Investors!
Because the stock market is currently strongly correlated to the energy sector, Friday’s rally responded in kind on the news of a surge of 12.3% in the NYMEX WTI sweet crude market after a report had suggested that OPEC may finally agree to cut its production to reduce the world glut. The news instantly oiled the S&P 500’s rise of 1.95%. However despite the strong daily gain, oil prices still ended the week down in spite of being the best one-day gain since February 2009, when WTI had gained 14.04%.
On the other side of the oil coin the number of U.S. oil rigs dropped by 30, or 5%, for the week!
Notwithstanding the rally, the S&P 500 remained in a loss position for the week of -0.81% and the market is still in correction with the worst performer, the Nasdaq, down since its peak on 20 July 15 by -16.89%, closing this week at 4337.51 points.
But could Friday’s action be the start of something beautiful? Unfortunately it was not accompanied by a corresponding increase in high volume. In fact it slipped from Thursday by 15%. Up days in declining volume and down days in rising volume are bad signals for bulls, as most of this month has shown.
The depressed oil prices are also rattling the banks, because of their credit exposure to the industry with rumours of liquidity drying up and losses mounting.

Read More »

The Age of the Alpha Stock

February 1, 2016

The fourth quarter 2015 earnings season is now in full swing. From what I have seen of the outstanding earnings surprises and favourable future guidance in the Grail Portfolios, there is enough thrust to propel them higher, as these three examples show.

On 28 January Under Armour rose 22.6%!
 

On 27 and 28 January Cirrus Logic climbed 29%!

From 25 January Covenant has risen 21.7%!
 

As of 29 January 110 stocks, or 37.4%, of the 294 stocks listed in Grail’s 5 principal portfolios have generated BUY? and only 31, or 10.4%, SELL? signals!
Stocks must have a +4% breakout to the upside to generate a BUY? signal and a -5% breakout to the downside to generate a SELL? signal. The reason for the ? is that any new momentum or trend needs to be confirmed before stocks are issued as recommendations.


These alpha-stock denominated portfolios establish large margins of safety, strong profits, and provide outstanding client retention and marketing advantages, which mediocre and passive strategies are unable to generate. As we have entered a new normal, those asset managers who do more of the same are likely to face client frustration and profit recession.

Read More »

Beware the Ides of the Earnings Season!

January 29, 2016

It is critical for an investor to be very vigilant during the earnings season, which already began on January 11 with Alcoa (AA) reporting its results. Not only do companies report their financials, but they also make other significant announcements, such as either raising or lowering their earnings guidance for the coming months.
Given the importance of this information, it is no surprise that a company’s stock can often soar or plunge on these disclosures. Therefore, investors need to be on their guard ready to sell, hold or buy. In making their decisions, they ought to take measures to protect their capital gains or if the stock reports turn out to be very favorable in terms of forward guidance set buy points; that is when an upward trend would be confirmed.
To arm yourself for these announcements it pays ‘dividends’ to know the earnings release dates for the stocks that you either own or have in your watch list. You should also be familiar with analysts’ consensus earnings forecasts and sales targets not just for the current quarter but for the next and the full year.
You must always keep in mind that a stock might not react as you would expect after an earnings report. Frequently this has to do with the market’s overall mood.

Read More »

With the eyes of the chameleon the market turns deep red!

January 27, 2016

The S&P 500 now stands at 1880.33 points, only 31.97 points from its 2015 opening price of 1848.36; for the broad market, a year’s meager gains almost wiped clean. The index’s P/E ratio now stands at 19.81, and is still well above its historic average of 15.57.

S&P 500 Year To Date Performance

The market confirmed my fears  of last week that it was in free-fall. In fact, it posted its worst ever 10-day losses  for a year-begin! The week saw only Utilities post a modest gain of 0.24%, and for the year so far none of the 31 industries are in positive territory; the best, being again Utilities with a loss of 0.83%, and the worst still Gold and Mining, being down 15.03%! Only 11.8% of the 6,181 stocks monitored by the Grail Equity Management System (GEMS) are in plus, and just 40 stocks in the S&P 500 could book gains of between 11.36% to 0.02%. The following index table shows the extent that uncertainty and fear are stalking the market:

Index  (Jan 22, 2016)
Year-to-datePerformance
From their2015 Peak
S&P 500
-8.0%
-11.8%
DJ-30
-8.2%
-12.7%
Russell-1000 Large Cap
-8.3%
-12.7%
S&P-Mid cap 400
-10.0%
-17.6%
Nasdaq
-10.4%
-14.0%
Russell-2000 Small Cap
-11.3%
-22.0%

US Equity Market held hostage by the Oil Bust
The above year-to-date declines and those from mid-2015 suggest that the market appears to be rapidly moving towards a bear market.
For most of 2015, the U.S.

Read More »

That was the week that was!

January 27, 2016

Week January 17-22
This was the first winning week of 2016 and of some relief to ordinary investors. The question is whether it is sustainable, or just a short-covering bounce, as is frequently the case when the market is undergoing a correction. Currently the S&P 500 has sunk 10.5%, the DJ-30 12.1%, and the NASDAQ 12.0%, since mid-2015. Calling a bottom, or a top, is a challenge even for professional investors. I would cite three short-term factors bearing on the question ‘Where do we go from here?’
Will Crude prices remain so low?
The first is the price behaviour of crude oil and the strong correlation it has with the stock market particularly since mid-December. Thus, the black gold’s 9% rally on Friday to close at $32.19 per barrel triggered Friday’s rally.

Oil in 2014

 
Whether the crude oil market can within a reasonable time recover part of its losses, or even remain over $30 per barrel is questionable, since Iran will soon pump its oil into the market and Saudi Arabia refuses to cut its production.
Will China become more consumer oriented?
The second factor is whether China is able in its transition to a more consumer-oriented economy to bring some element of stability into its markets in the near-term.
2015 Earnings Season
The final factor is the fourth quarter 2015 earnings season. In the next two weeks, the market will be awash with the majority of reports.

Read More »

The Market’s Bad Omens mount as the Black Swan population grows!

January 15, 2016

Last week’s market action confirmed clearly its corrective trend. I cannot say more than that, because when systematic risk kicks in the good, the bad, and the ugly all suffer the same slippery fate. Clearly it prophecies a healthy renewal once this bear trend is over, but first this downward phase has to be over-done before there is a capitulation that would signal a key reversal. For now, there is not much to expect. As the market is in the grip of a profit recession on the one side, and a faltering global economy, worsened by deflationary commodity prices, on the other! To make matters worse, the U.S.’s economy is out of sync with the rest of the world, and the Federal Reserve both at home and abroad in pursuit of its planned interest rate increases  will cause a growing rift between the U.S. and other economies, before contagion comes home as a backlash.

The stock market began the New Year to face an Asian world of China’s steep stock market declines and North Korea’s mini hydrogen bomb test to add to the flock of black swans circulating around the globe! The bears gorged themselves full this week with all 31 industrial sectors negative. Tobacco, as best performer lost 0.99% and the worst of 31 industries was Automotive, which fell 10.61%! The S&P 500’s P/E Ratio stands at 20.25 times earnings and declining. However, the long-term average is 15.

Read More »

Miserable week that ended a miserable year

January 5, 2016

It was a miserable week that ended a miserable year, followed by an apparently bad first week in 2016.
In fact it was the S&P 500’s worst since the start of the bull market in 2009, ending the year down 0.73% at 2043.94 points! Volume was seasonally very low. If you are frustrated with the stock market’s performance, I can well understand it, but if you look at the video (Ctrl + Click) below, “Ouch! 5 CEOs lost a combined $20 billion in 2015!”, you may be comforted to see that Warren Buffet personally lost a whopping $7.5 billion with the two Berkshire Hathaway stocks down over 12% on the year.
The S&P 500 index continued to slip in the short week. For the year 220 stocks (46.65%) posted gains, 281 (55.75%) posted losses and 3 were flat. Curiously there are 504 stocks listed in the index.  The prevailing sentiment seems to signal a seamless continuation into this year as the S&P 500  has a multiple of 19 times and appears to be topping out as indicated by S&P 500 companies’ earnings suffering from a ‘growth recession’, which is mainly not the case with Grail selected stocks. Citibank sees the U.S. economy weakening and thus an increased chance of a recession.
Admittedly, a lack of business confidence has contributed to this kind of sentiment.

Read More »

Only high-Alpha Investing in 2016 will be profitable!

January 1, 2016

As you may have expected, last week the market moved more into wind-down mode as the week progressed and dosed to a near-sleep on Friday’s half-day with the S&P500’s volume down 53%. This is the usual script at this time of year, so that the market ignored the WTI crude oil price, which it had recently been closely correlated to, when it moved from last week’s close $34.73 per barrel to this week’s price of $38.10, an increase of 3.38%.
The market still languishes in its ‘under pressure’ stasis, although the S&P 500 pushed up through its 500-moving average, but only just, and is resting on its 200-day moving average. Looking back down the year, the S&P 500 needle has only moved finitely to end the week barely in plus at 0.1% year-to-date! The index had peaked as far back as on 21 May, when it reached 2130.81, or +3.49% from year’s begin! Since then is has slid from peak to trough losing 3.28% to-date from its May highest high! Also given that the prices of 5,529 of the market’s 8,288 stocks, or 66.7%, are at zero or less for the year, Grail portfolios on the other hand have the propensity of generating more than 30% returns per annum, as this portfolio shows.

Russ Koesterich on the 2016 profit recession

Russ Koesterich of Blackrock believes that the market is experiencing a profit recession. To watch the video press Ctrl + Click.

Read More »

The Low Volatility Anomaly and the Failures of Your Asset Manager

October 13, 2015

According to John Henry Smith, fund managers are too much focused on bench-marking their performance to a market index, over-emphasizing the importance of “alpha”. But asset managers should abstract from alpha and construct portfolios that have lower risk and higher return than the market. Impossible?
This post is the second part of The Fallacies of Portfolio Volatility Measurements.
The Market Return
For reasons of consistency, fund managers are primarily focused on benchmarking their performance to a broad market index and ignore attempts at profit maximization.  This is because of the mistaken belief that portfolio diversification diminishes approximately two thirds of all specific stock risks, leaving only the market return as the basis of reward. Thus the removal of these risks explains why index funds dominate all other types of equity investing, but not the rationale for over-diluting the Alpha element. As a consequence, the pursuit of merely achieving the market return for consistency’s sake requires the construction of portfolios with low Alphas, which by default require the selection of stocks with mediocre growth prospects.

Read More »

The Fallacies of Portfolio Volatility Measurements

September 27, 2015

Standard deviation (sigma σ) measures volatility or the dispersion of random values around the mean of a variable such as a portfolio or individual stock prices, but does not measure the direction of a trend.
Standard Deviation as volatility measure
What has become the bedrock of finance is an out-of-date almost universally accepted finance theory, which uses the statistical normal distribution (the Gaussian bell curve) as the measure of risk per se.
In reality stocks are found not to be normally distributed but in gross measure leptokurtic and skewed. As a consequence, price changes do not behave as expected, so that standard deviation can be a very misleading proxy for risk as the following example shows.
Two traders with similar standard deviations may show entirely different distributions of return! This is because the volatility attributes of stock prices are not uniformly linear, contrary to that assumed by conventionally accepted financial theory. Therefore one portfolio’s volatility profile may look like the familiar normal distribution; but the other will be shown to have a much greater degree of kurtosis and skewness.

Read More »

Mark of a true investor: He disregards instincts

September 14, 2015

The stock market works very differently than the natural world. When an animal is spooked, its first reaction is to freeze. Naturalists say that freezing helps animals escape the attention of predators, which hunt by sensing movement. Try that trick in the stock market – freezing when you should be taking action – and you’ll either be knocked silly by the bears or left behind by the bulls.
Instincts are counter-productive
We do not believe in the “rely on your gut” principle, propagated on Investopedia. On the contrary, instincts that were useful in prehistoric days are counter-productive in the world of investing. The instinct to freeze isn’t much use when facing a correction. How is it then that well-trained martial artists, elite police officers and Special Forces soldiers tend to react decisively, as they did recently on a Paris train to a threat while ordinary people froze? Often you will hear the elite say after a crisis that their “training took over.” just as it did for these heroes.
Train yourself
Training enables the elite performer to react properly, despite their natural instincts. The well-trained investor shares this same trait for action, when many freeze too afraid to respond to the threat warranted by the situation.

Read More »

Listen to the Sirens of the Stock Market at your Peril!

September 3, 2015

John Henry Smith of Grail Securities (Switzerland) shows that the financial markets have always been awash with its own brand of Sirens, who dolefully prophesied the complete collapse of whole economic systems. For him Pericles gave the best advice: “The key is not to predict the future, but to be prepared for it!”
——————————————————————————————

In Homer’s Odyssey, the Sirens were dangerous and beautiful maidens, who irresistibly lured sailors with their enchanting, but sad, music and voices to shipwreck and death on the rocky coast of their island. In the myth, the two of them were purported to possess the gift of prophecy.
They were punished by the Goddess Demeter, because they had failed to protect of her daughter, Persephone, against Hades, the God-King of the Underworld.The financial markets have always been awash with its own brand of Sirens, who dolefully prophesied the complete collapse of whole economic system to the cataclysmic fall of stock, commodities, or bond markets as these summary examples show:
Extract from ‘The Great Financial Catastrophe’ by Egon von Greyerz, dated 20 August 2015“So the Great Financial Crisis of 2007-9 will now transcend into the Great Financial Catastrophe. This could very well involve a total reset or more likely a collapse of the world economy.

Read More »

Adjust Your Sales in today’s Choppy Market!

August 22, 2015

This year began with the U.S. stock market facing ever increasing headwinds that whipped up choppier waves with whiter crests and deeper troughs. These harsh winds have blown from the four points of the compass, namely the U.S. Federal Reserve Board, the Euro/Greek crisis, the energy and commodity maelstroms, and now the icy chills out of China, all combining to stir up the treacherous currents of globally unstable economic weather patterns.When the market’s weather is sunny and breezy, the course ahead is more certain so that investors have little trouble planning how to reach their profit destinations! However, this year’s choppiness has tested the very skills of even the most seasoned inventors in their abilities to navigate a safe passage through the bracing gusts and tidal cross-currents of today’s market, enduring these eight months of gale-like volatility.In such circumstances, you need to ask some hard questions about the stocks in your portfolio. One question would be ‘How well are my stocks weathering this constant buffeting? (No offence to Mr. Warren Buffet). Those stocks that are situated in outperforming sectors, such as Drugs, Health Services, and Retail are more likely to have suffered less damage than those in Electronics, Energy and Metals and Mining.

Read More »

Don’t Over-Complicate Investment!

August 18, 2015

Just another Rube Goldberg Machine

The Rube Goldman machines
We normally like to keep things simple and do things the easy way, but we’re completely fascinated by Rube Goldberg machines. They require a level of skill and patience we doubt we’ll ever posses and they’re the ultimate expression of doing something just because you can.


Keep It Simple, Stupid or kiss goodbye to your money
Investors sometimes are tempted to build convoluted Rube Goldberg-type contraptions to tell them when to buy and sell a stock. Goldberg was a newspaper cartoonist whose work was syndicated in the 1920s and ’30s. His trademark was sketching unnecessarily complicated machines to do something simple, like using a 13-step device to wipe your mouth with a napkin.
To help you with your investment decisions the following effective investment guidelines are offered because of their elegant simplicity:
As a bull, ensure that you are in an up-trending market
Find a stock with elite fundamentals
Wait for a support base to form after a prior uptrend
Buy the stock when it breaks out of the support base in strong volume
Cut your losses quickly if the stock fails
Granted, mastering these simple steps takes time, study and practice. You have to learn what constitutes an elite stock, a proper base and a healthy market.

Read More »

John Henry Smith, the Grail: Abnormally High Returns

August 18, 2015

John Henry Smith of Grail Securities (Switzerland) specializes in the U.S. stock market and offers a unique and powerful advisory service to private investors, institutional investors, and SME asset managers, who are seeking to consistently beat the market.
All our strengths are at your disposal to provide stock market research and recommendations with the only aim of growing wealth. To achieve this we develop with you a customized investment strategy in terms of your risk and return preferences.

John’s articles
John’s very first articles, many more will come…
Don’t Over-Complicate Investment!, Keep It Simple or kiss goodbye to your money
Investors sometimes are tempted to build convoluted Rube Goldberg-type contraptions to tell them when to buy and sell a stock. Goldberg was a newspaper cartoonist whose work was syndicated in the 1920s and ’30s. His trademark was sketching unnecessarily complicated machines to do something simple, like using a 13-step device to wipe your mouth with a napkin.

Grail’s mission is to build client wealth by selecting high caliber U.S. stocks that have excellent probabilities of significantly outperforming the market.

Most investors overlook the fact that there are great and exciting opportunities in equities. This is because passive investing has given rise to the plethora of index-tracking funds and EFTs.

Read More »