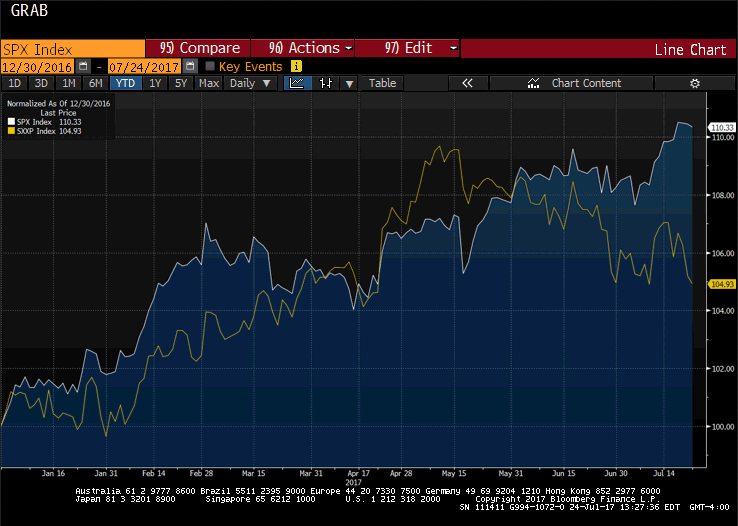
Many asset managers have been bullish European shares this year. European and emerging market equities are among the favorite plays this year. Surveys of fund managers find that the allocation to US equities is among the lowest in nearly a decade. The case against the US is based on overvaluation and being a crowded trade. Many are concerned about too hawkish of a Federal Reserve (policy mistake) or the lack of tax reform. This Great Graphic, created on Bloomberg shows the S&P 500 (white line) and the Dow Jones Stoxx 600 (yellow line). The two time series are indexed to the start of the year. For the year-to-date, the S&P 500 is up about 10.3% while the Dow Jones Stoxx 600 is up almost 5%. We suspect many will be
Topics:
Marc Chandler considers the following as important: Dow Jones Stoxx 600, equities, Featured, FX Trends, Great Graphic, newsletter, S&P 500 Index, S&P 500 Index
This could be interesting, too:
Nachrichten Ticker - www.finanzen.ch writes Krypto-Ausblick 2025: Stehen Bitcoin, Ethereum & Co. vor einem Boom oder Einbruch?
Connor O'Keeffe writes The Establishment’s “Principles” Are Fake
Per Bylund writes Bitcoiners’ Guide to Austrian Economics
Ron Paul writes What Are We Doing in Syria?
Many asset managers have been bullish European shares this year. European and emerging market equities are among the favorite plays this year.
Surveys of fund managers find that the allocation to US equities is among the lowest in nearly a decade. The case against the US is based on overvaluation and being a crowded trade. Many are concerned about too hawkish of a Federal Reserve (policy mistake) or the lack of tax reform.
| This Great Graphic, created on Bloomberg shows the S&P 500 (white line) and the Dow Jones Stoxx 600 (yellow line). The two time series are indexed to the start of the year. For the year-to-date, the S&P 500 is up about 10.3% while the Dow Jones Stoxx 600 is up almost 5%. We suspect many will be surprised first by the outperformance and then by the magnitude.
To be sure, the performance of the equity market is not the only component of the total return, which is what investors are ultimately interested. For example, dividend are also part of the total return. Consider that the dividend yield of the S&P 500 is a little below 2%,while the Dow Jones Stoxx 600 dividend yield is a little more than 3.3%. The third component of total return is the currency component for foreign investors. Many who have advocated European shares recommended them on an unhedged basis. The euro has appreciated about 10.8% this year. If we pro-rate dividend yield for half a year and add the euro to the return of the Dow Jones Stoxx 600, the total return for a dollar-based investors would be nearly 17.4%. The dollar based investor would earn closer to 11.3% in the S&P 500. A euro-based investor would have earned about 6.65% thus far this year between the dividend and appreciation of the Dow Jones Stoxx 600. If the euro-based investor bought the S&P 500 on a hedged basis, they would have earned a around 21%. We calculated that the hedge using one year Euribor and Eurodollar rates, subtracted from the euro’s appreciation, and added to the appreciation and dividend yield of the S&P 500. |
S&P 500 and the Dow Jones Stoxx 600 Index(see more posts on Dow Jones Stoxx 600, S&P 500 Index, ) |
Tags: Dow Jones Stoxx 600,equities,Featured,Great Graphic,newsletter,S&P 500 Index

