Summary:
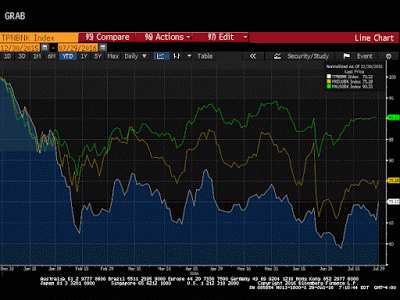
This Great Graphic was composed on Bloomberg, and it shows the performance of bank share indices of the major bourses. The time series are indexed to 100 at the start of this year. The green line, which is off about 6.6% this year is the MSCI US bank index. The yellow line is the MSCI European bank index. It is off 25% this year. The white line is the Topix bank shares. It is fallen 30% this year, even with today’s sharp gains. Our constructive outlook for the US dollar is predicated on divergence, and we often discuss the divergence of monetary policy. However, the divergence in the health of the financial sector, and the negative interest rates, is another dimension of our meme which is also important.
Topics:
Marc Chandler considers the following as important: Featured, FX Trends, Great Graphic, Japan Topix Bank Index, MSCI European Bank Index, MSCI US Bank Index, newsletter
This could be interesting, too:
Nachrichten Ticker - www.finanzen.ch writes Krypto-Ausblick 2025: Stehen Bitcoin, Ethereum & Co. vor einem Boom oder Einbruch?
Connor O'Keeffe writes The Establishment’s “Principles” Are Fake
Per Bylund writes Bitcoiners’ Guide to Austrian Economics
Ron Paul writes What Are We Doing in Syria?
|
This Great Graphic was composed on Bloomberg, and it shows the performance of bank share indices of the major bourses. The time series are indexed to 100 at the start of this year.
The green line, which is off about 6.6% this year is the MSCI US bank index. The yellow line is the MSCI European bank index. It is off 25% this year. The white line is the Topix bank shares. It is fallen 30% this year, even with today’s sharp gains.
Our constructive outlook for the US dollar is predicated on divergence, and we often discuss the divergence of monetary policy. However, the divergence in the health of the financial sector, and the negative interest rates, is another dimension of our meme which is also important.
|
 Green: MSCI US Bank Index, Yellow: MSCI European Bank Index, White: Topix Bank Index |
