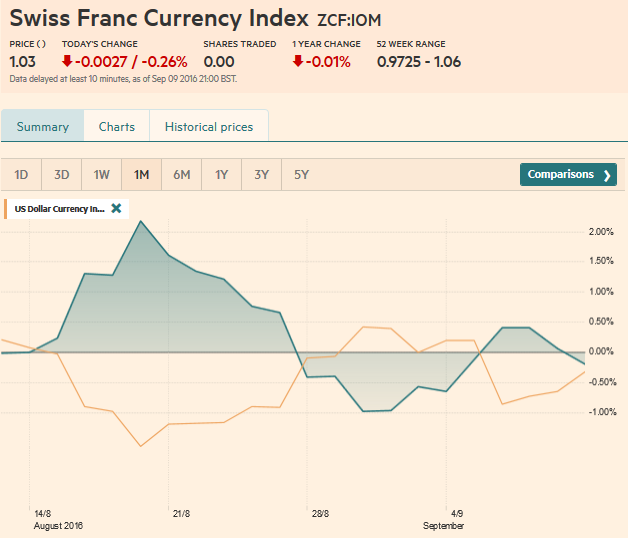
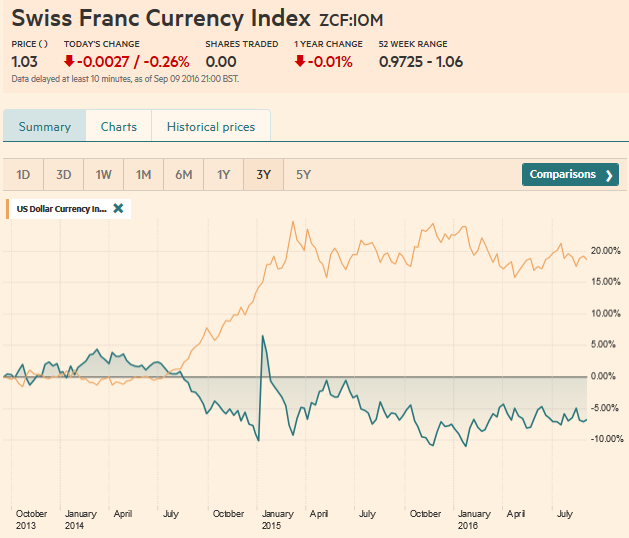
Swiss Franc Currency Index The Swiss Franc index remained mostly unchanged during the last week: Some gains against the dollar, but losses versus the euro. Since Tuesday the euro moved upwards against CHF. Given thatSwiss GDP was stronger than the one in the euro zone, this is surprising. But we must recognize that Draghi could be the reason. Inflation forecasts of 1.2% in 2017 and 1.8% in the euro zone would mean the ECB hikes rates maybe in 2018 or 2019. I personally do not believe it, given that wage inflation in Italy or Spain is clearly under 1%. This is lower than Swiss wage inflation of 0.8%.The second reason for the stronger euro is euro short covering: Against both dollar and CHF. Speculators were net long CHF against USD,while they are net short on the euro. Click to enlarge. Swiss Franc Currency Index (3 years) The Swiss Franc index is the trade-weighted currency performance (see the currency basket) On a three years interval, the Swiss Franc had a weak performance. The dollar index was far stronger. The dollar makes up 33% of the SNB portfolio and 25% of Swiss exports (incl. countries like China or Arab countries that use the dollar for exchanges). Contrary to popular believe, the CHF index gained only 1.73% in 2015. It lost 9.52% in 2014.
Topics:
George Dorgan considers the following as important: Canadian Dollar, Crude Oil, EUR/CHF, Euro Dollar, Featured, FX Trends, MACDs, newslettersent, Swiss Franc Index, U.S. Treasuries, US Dollar Index, USD/CHF
This could be interesting, too:
Nachrichten Ticker - www.finanzen.ch writes Krypto-Ausblick 2025: Stehen Bitcoin, Ethereum & Co. vor einem Boom oder Einbruch?
Connor O'Keeffe writes The Establishment’s “Principles” Are Fake
Per Bylund writes Bitcoiners’ Guide to Austrian Economics
Ron Paul writes What Are We Doing in Syria?
Swiss Franc Currency IndexThe Swiss Franc index remained mostly unchanged during the last week: Some gains against the dollar, but losses versus the euro. Since Tuesday the euro moved upwards against CHF. Given thatSwiss GDP was stronger than the one in the euro zone, this is surprising. But we must recognize that Draghi could be the reason. Inflation forecasts of 1.2% in 2017 and 1.8% in the euro zone would mean the ECB hikes rates maybe in 2018 or 2019. I personally do not believe it, given that wage inflation in Italy or Spain is clearly under 1%. This is lower than Swiss wage inflation of 0.8%. |
|
Swiss Franc Currency Index (3 years)The Swiss Franc index is the trade-weighted currency performance (see the currency basket)On a three years interval, the Swiss Franc had a weak performance. The dollar index was far stronger. The dollar makes up 33% of the SNB portfolio and 25% of Swiss exports (incl. countries like China or Arab countries that use the dollar for exchanges). Contrary to popular believe, the CHF index gained only 1.73% in 2015. It lost 9.52% in 2014., when the dollar (and yuan) strongly improved. |
|
USD/CHF
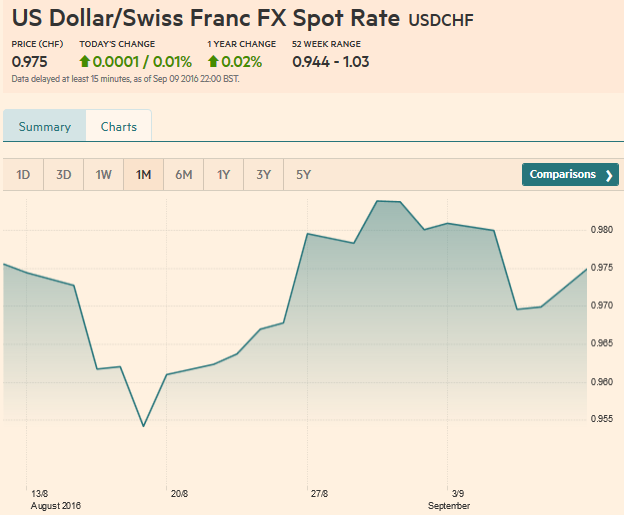
The Swissie was somewhat stronger against the dollar. This reflected somewhat the surprisingly weak ISM Non-Manufacturing PMI. It took the market a few days to overcome the shockingly poor non-manufacturing ISM (51.4 vs. 55.5).
However, by the end of the week, the US dollar bulls had
regained the upper end. The September Fed funds was implying a yield of 41.75 bp, up a quarter of a basis point from the September 2 close. Similarly, the 2-year yield was essentially unchanged on
the week, while the 10-year yield was up six bp on the week and 15 bp from the ISM-inspired low. At 1.66%, the 10-year yield is at its highest level since the UK referendum. The Atlanta Fed GDP tracker has the US economy growing 3.3% this quarter, while the NY Fed’s tracker says 2.8%. This is after the adjustments taking into account this past week’s data, including inventories and the service ISM. |
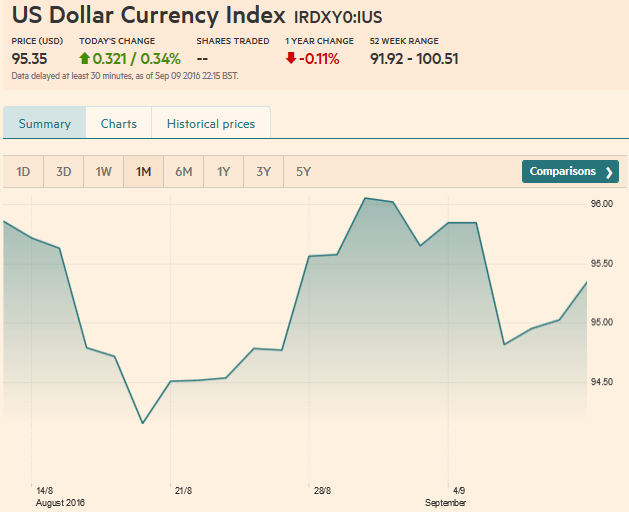
US Dollar IndexThe US Dollar Index rebounded smartly off the trendline we have been monitoring. It is drawn off the May, June and August lows. It caught last week’s low of almost 94.45.
Rebounding before the weekend, it stalled in front of 95.60, nearly meeting a retracement level of the pullback that began at the start of the month. A move above 95.60 targets the 96.15-96.25 area that contains the August 31 high and the 200-day moving average.
Above there, the July high around 96.50 beckons.
|
|
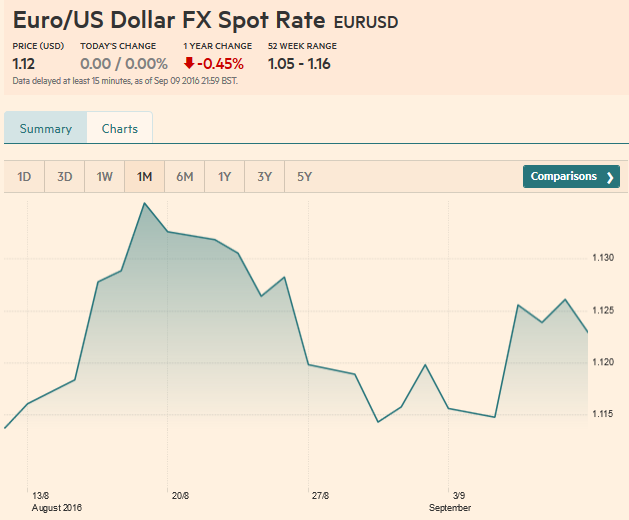
EUR/USDThe euro has fallen for the past four Fridays. It is an interesting pattern, but the significance is not clear. A break of $1.12 could spur slippage toward $1.1150-$1.1170, but we suspect the euro will be supported by caution ahead of Fed’s Brainard and what is expected to be a softer US retail sales report. On the upside, congestion around $1.1250 may hinder strong gains, especially given the proximity of the FOMC meeting. |
|
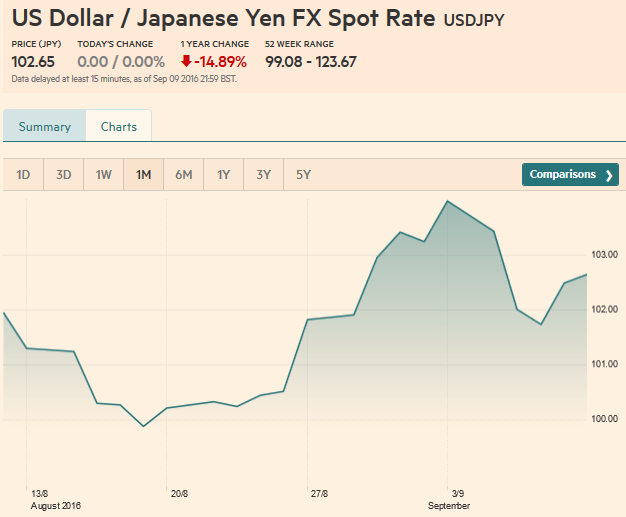
USD/JPYSimilar with the euro, the dollar has advanced against the yen for the past four Fridays. The next immediate target is the JPY103.15-JPY103.25 area, and then the recent high a little above JPY104.30. The technical tone though remains vulnerable. The MACDs may cross lower, while the Slow Stochastics have already turned. The sharp drop in US equities before the weekend will likely weigh on Asian shares at the start of the new week. The developments in the equity market may, in the first instance, hamper the dollar’s recovery against the yen. |
|
GBP/USD
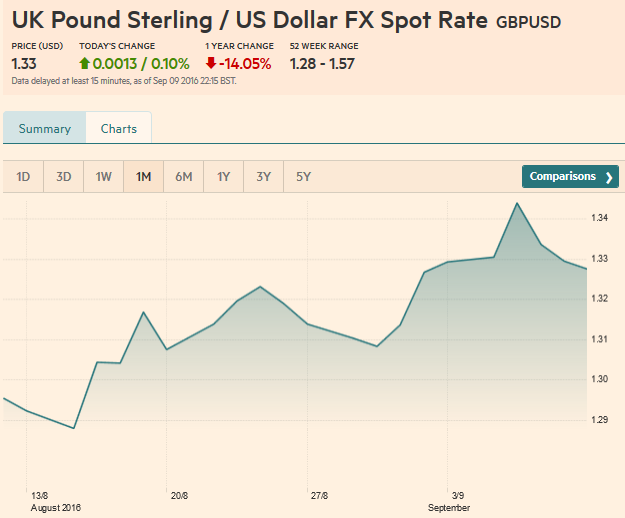
With the apparent resilience of the UK economy, doubts in some quarters that Brexit will ever take place, and conviction that the BOE will not cut rates at this week’s MPC meeting helped lift sterling through the August highs. It reached $1.3445 before finding new sellers. The price action reinforces the significance of the $1.35 area cap. Within the $1.30-$1.35 range that has dominated since the referendum, sterling may encounter initial support in the $1.3160-$1.3180 area. A month-long up trendline comes in near $1.3240 on September 16. The technical indicators we use are mixed. The RSI is heavy, and the MACDs have not crossed but are poised to, and the Slow Stochastics are still headed higher. |
|
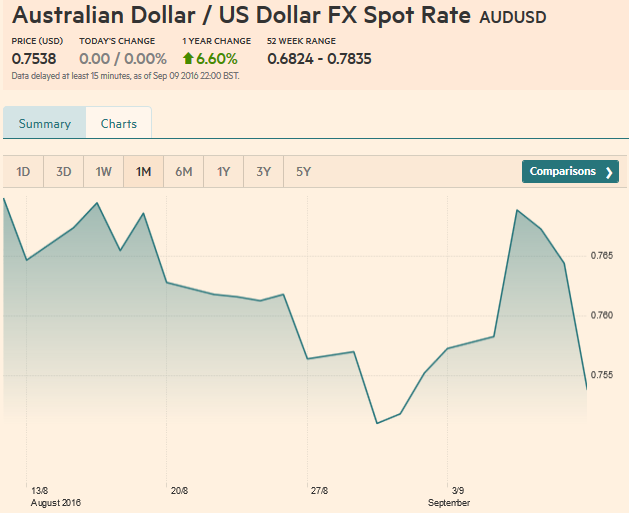
AUD/USDThe technical tones of the Australian and Canadian dollars have deteriorated. The Aussie posted a key downside reversal on September 8 and saw follow-through selling before the weekend. The nearly two cent was the largest decline over two days since the UK referendum. Like the Canadian dollar, the Australian dollar’s RSI and MACDs warn of the risk of additional selling over the coming sessions. A break of the $0.7490-$0.7500 area is needed to boost confidence that a high of some import is in place. |
|
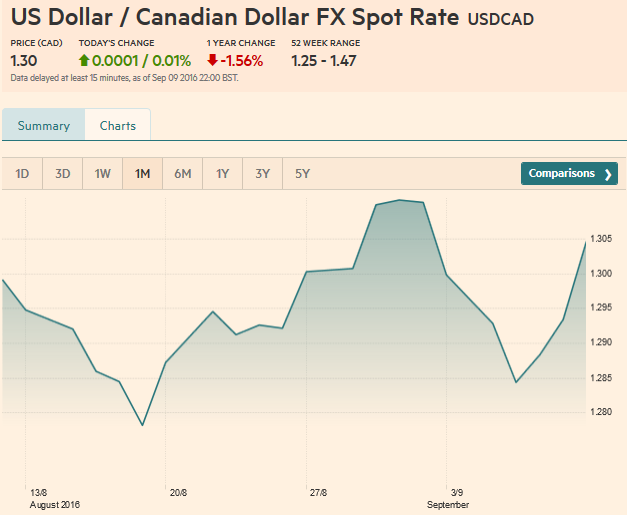
USD/CADThe US dollar recovered off the midweek test on CAD1.28 and finished the week near CAD1.3050. The Canadian dollar’s pre-weekend loss of a little more than 0.8% was the largest loss in over month. It was sufficient to offset the gains it has registered earlier in the week. It closed the week with about a 0.4% decline, the most among the high income countries. The RSI and MACDs suggest additional losses are likely. The next objective is CAD1.3150. |
US Dollar - Canadian Dollar FX Rate(see more posts on Canadian Dollar, ) |
Crude Oil
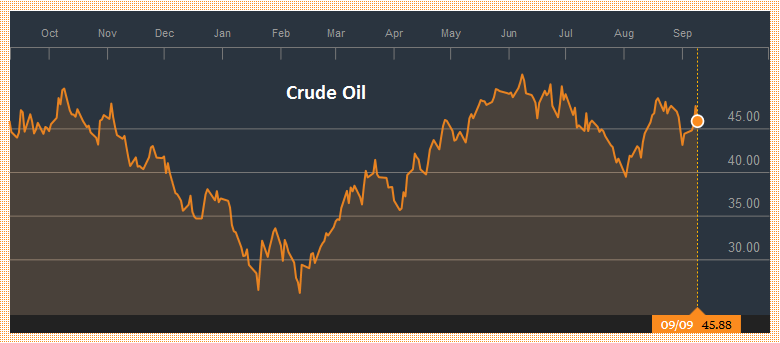
It looks like participants exaggerated the significance of the sharp drop in oil and gas stockpiles. To be sure, there was not a sudden adjustment to the oversupply. Rather, it seemed weather-induced. Moreover, the odds of an agreement to freeze output is remote at best, given the recent comments from Saudi and Russian officials. Also, Iran’s ability to recoup the output lost during the embargo has slowed (if not stalled) over the past period. The October light sweet futures contract has already retraced 38.2% of its gains this month. The 50% retracement is found near $45.40, and the 61.8% retracement is at $44.60. On top of its own dynamics, a strengthening of the dollar may also be seen as negative for prices. |
|
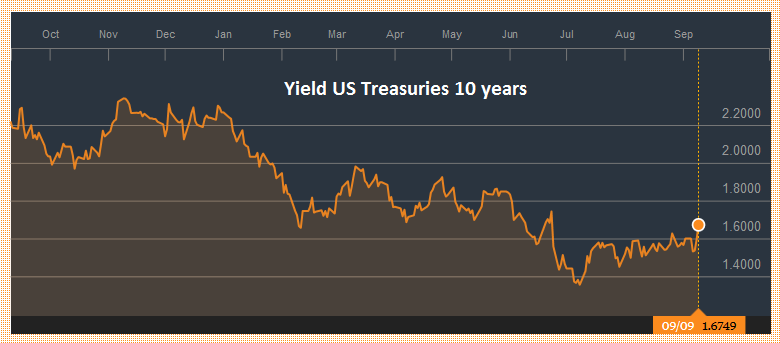
US TreasuriesUS 10-year Treasury yields appear to be breaking out of the 1.50%-1.60%. It may take some time for participants to become convinced. If the range is broken, then the next important level is in the 1.70%-1.75%. Recall that as recently two months ago; the US 10-year yield was near 1.32%. It was around 1.66% ahead of the weekend. An important warning to the bears is that the technical readings seem stretched, and the fact that the December futures contract closed below its lower Bollinger Band may inject caution, especially ahead of Brainard speech and the US retail sales report. |
Yield US Treasuries(see more posts on U.S. Treasuries, ) |
S&P 500 Index
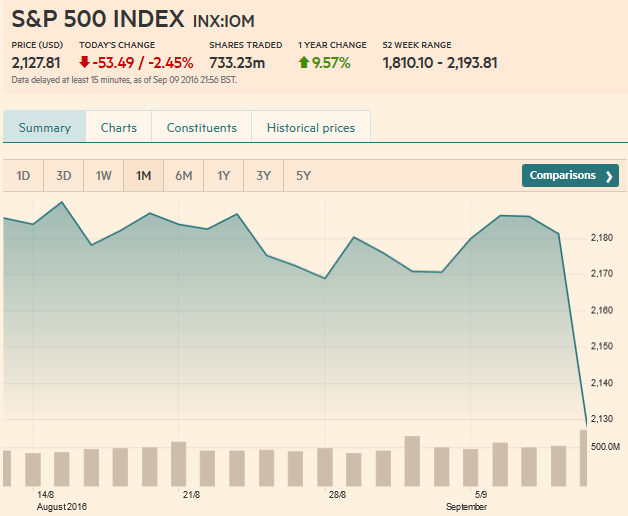
From a technical perspective, the S&P 500 looks ugly. The gap lower before the weekend leaves a four-day island top in its wake. Recall that on September 2, the S&P 500 gapped higher, leaving a few cent gap unfilled. The sharp loss on September 9 brought the S&P 500 to two-month lows. The RSI and MACDs have weakened. The S&P 500, like the 10-year note futures, closed below its lower Bollinger Band. However, narrow trading ranges and low volatility had seen width of the Bollinger Bands narrow considerable, and even a small decline would have pushed it outside the Bands. If the gap created by the sharply lower opening on September 9 is a normal gap, it should be filled in the coming sessions. If it is not filled shortly, the significance of its bearish signal is enhanced. The initial downside target is in the 2116-2120 range, which corresponds to a 38.2% retracement of the rally since late June and the 100-day moving average. |
Charts and CHF data added by George Dorgan and the snbchf team, Text Posted by Marc Chandler on Marc to Markets.

