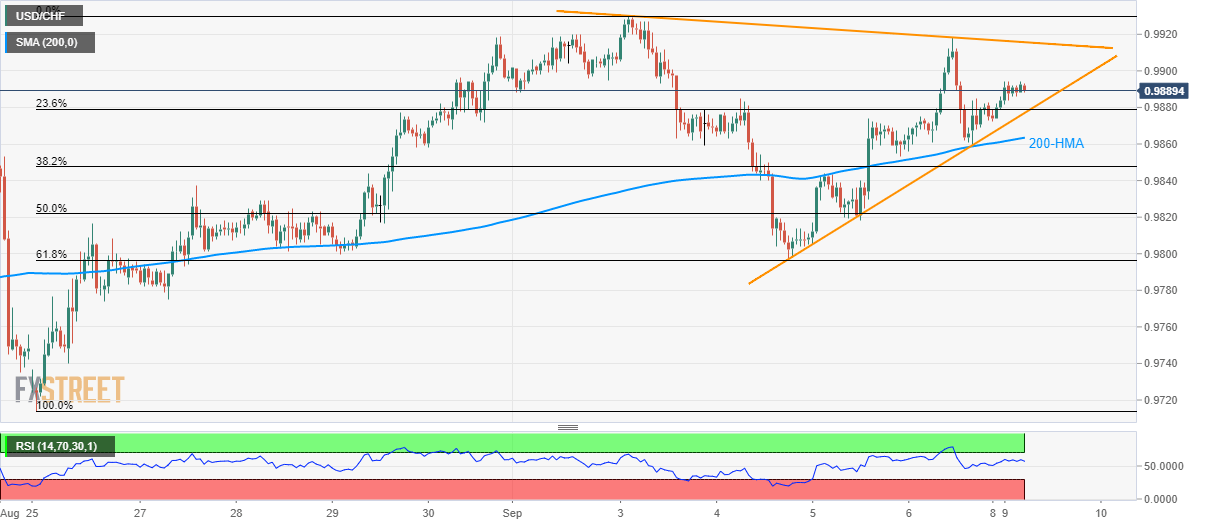
USD/CHF clings to 0.9890 after unemployment data. A four-day-old symmetrical triangle limits the pair’s near-term moves. 200-HMA adds to the support while 0.9920 limits the upside. USD/CHF remains largely unchanged after the headline job data as it trades near 0.9890 ahead of Monday’s European session open. August month seasonally adjusted Unemployment Rate for Switzerland matches 2.3% forecast and prior. Hence, the pair is more likely to continue within immediate symmetrical triangle formation that portrays 0.9900 as immediate resistance ahead of the pattern’s upper-line of 0.9916 in contrast to pattern’s support near 0.9875. While an upside break of 0.9920 can propel prices to the monthly top of 0.9930, pair’s break of 0.9875 can avail 200-hour simple moving
Topics:
Anil Panchal considers the following as important: 4) FX Trends, 4.) FXStreet, Featured, newsletter
This could be interesting, too:
Alex J. Pollock writes How Does the Federal Reserve Fit into Our Constitutional Order?
Adnan Al-Abbar writes What Can Carl Menger Teach Us about Falafel Sandwiches?
James Bovard writes Biden Perpetuates Washington’s Idiotic Steel Trade Policies
Alex J. Pollock writes The Federal Reserve’s Capital Has Now Plummeted to Negative 1 Billion
- USD/CHF clings to 0.9890 after unemployment data.
- A four-day-old symmetrical triangle limits the pair’s near-term moves.
- 200-HMA adds to the support while 0.9920 limits the upside.
| USD/CHF remains largely unchanged after the headline job data as it trades near 0.9890 ahead of Monday’s European session open.
August month seasonally adjusted Unemployment Rate for Switzerland matches 2.3% forecast and prior. Hence, the pair is more likely to continue within immediate symmetrical triangle formation that portrays 0.9900 as immediate resistance ahead of the pattern’s upper-line of 0.9916 in contrast to pattern’s support near 0.9875. While an upside break of 0.9920 can propel prices to the monthly top of 0.9930, pair’s break of 0.9875 can avail 200-hour simple moving average (HMA) level of 0.9864 as an intermediate halt prior to declining to 61.8% Fibonacci retracement of it’s August 25 to September 03 advances, at 0.9800. It should also be noted that pair’s rally beyond 0.9920 enables it to question August month top surrounding 0.9975 ahead of pushing bulls to 1.0000 psychological magnet. |
USD/CHF hourly chart, September 9(see more posts on USD/CHF, ) |
Trend: sideways
Tags: Featured,newsletter

