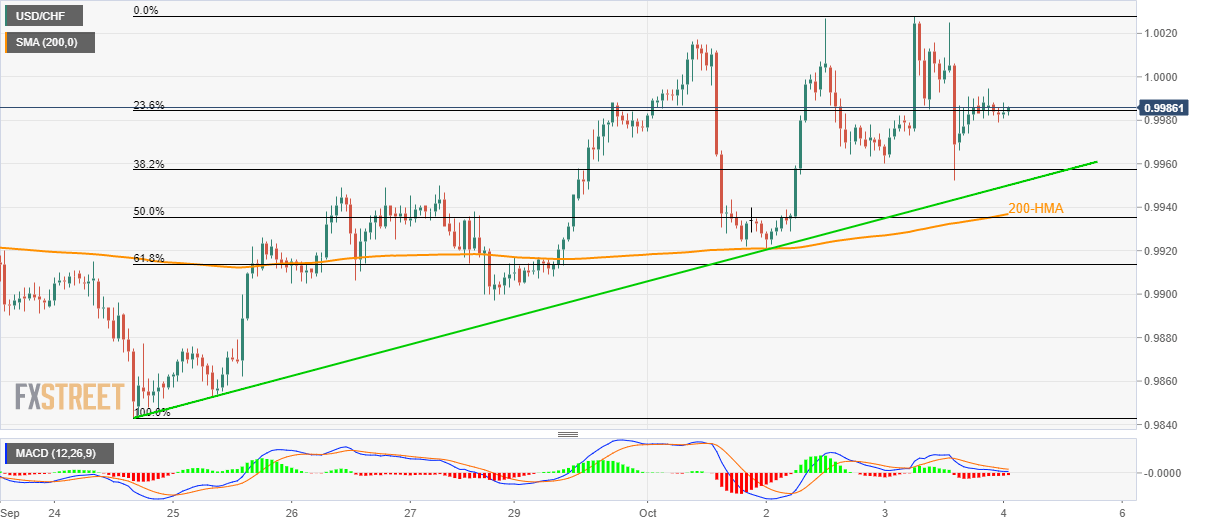
USD/CHF seesaws around 23.6% Fibonacci retracement after witnessing multiple failures to cross 1.0030. A nine-day-old rising trend-line, followed by a confluence of 200-HMA/50% Fibonacci retracement limits near-term declines. Despite witnessing pullbacks from 1.0030, USD/CHF is yet to slip beneath key supports as it clings to 0.9985 during early Friday. The pair seesaws near 23.6% Fibonacci retracement of its upswing from last Tuesday and can revisit 38.2% Fibonacci retracement level surrounding 0.9960 during further declines. However, an upward sloping trend-line since September 24, at 0.9950, followed by a 200-hour simple moving average (HMA) and 50% Fibonacci retracement, near 0.9937/35, could question pair’s further south-run. Should there be increased
Topics:
Anil Panchal considers the following as important: 1) SNB and CHF, 1.) FXStreet on SNB&CHF, Featured, newsletter, USD/CHF
This could be interesting, too:
Eamonn Sheridan writes CHF traders note – Two Swiss National Bank speakers due Thursday, November 21
Charles Hugh Smith writes How Do We Fix the Collapse of Quality?
Marc Chandler writes Sterling and Gilts Pressed Lower by Firmer CPI
Michael Lebowitz writes Trump Tariffs Are Inflationary Claim The Experts
- USD/CHF seesaws around 23.6% Fibonacci retracement after witnessing multiple failures to cross 1.0030.
- A nine-day-old rising trend-line, followed by a confluence of 200-HMA/50% Fibonacci retracement limits near-term declines.
| Despite witnessing pullbacks from 1.0030, USD/CHF is yet to slip beneath key supports as it clings to 0.9985 during early Friday.
The pair seesaws near 23.6% Fibonacci retracement of its upswing from last Tuesday and can revisit 38.2% Fibonacci retracement level surrounding 0.9960 during further declines. However, an upward sloping trend-line since September 24, at 0.9950, followed by a 200-hour simple moving average (HMA) and 50% Fibonacci retracement, near 0.9937/35, could question pair’s further south-run. Should there be increased downside pressure below 0.9935, September 27 low close to 0.9900 will be sellers’ choice. Meanwhile, pair’s successful rise above 1.0030 could propel it to the late-May top adjacent to 1.0100. |
USD/CHF hourly chart, September - October 2019(see more posts on USD/CHF, ) |
Trend: bullish
Tags: Featured,newsletter,USD/CHF

