 Perspectives Pictet
The proposals would pave the way for Xi Jinping to remain in power beyond 2022, helping ensure policy continuity.According to Xinhua News Agency, the Central Committee of the Communist Party of China (CPC) has proposed a number of amendments to the Chinese constitution, pending ratification at the upcoming National People’s Congress. One important amendment proposed is removal of the term limits for the president and the vice president of China, which paves the road for Xi Jinping to stay as...
Read More »Do not hesitate to contact Pictet for an investment proposal. Please contact Zurich Office, the Geneva Office or one of 26 other offices world-wide.
TLTRO – no more bets!
European banks continue to be subsidized via cheap ECB funding. The ECB launched a second series of Targeted Long-Term Refinancing Operations (TLTRO-II) in March 2016 with the specific objective of boosting bank credit. Today’s M3 report, including bank credit flows for January 2018, will be used to calculate the interest rate applied on TLTRO-II loans, which amount to EUR740bn in aggregate.With the notable exception of Italy, Portugal and the Netherlands, we estimate that most commercial...
Read More »Who will tackle Italy’s root problems?
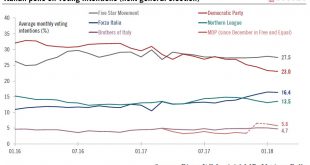
Just ahead of Sunday’s general election, there is little sign of appetite among the leading parties to tackle the significant challenges that Italy faces.According to the last polls published before the blackout period, no single party or coalition is projected to win an outright majority in the Italian general election next Sunday. Given cyclical growth, near-term economic risks seem to be contained, but Italy’s potential growth rate is low, and youth unemployment is among the highest in...
Read More »Less scope for yen and Swiss franc depreciation
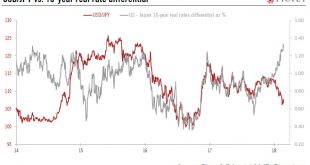
In spite of rate differentials, the dynamics driving US Treasuries and possible changes in global growth may limit yen and franc decline.The start of the year has seen the Japanese yen and Swiss franc appreciate strongly against the US dollar (they rose by 5.6% and 4.4% respectively between 1 January and 22 February) despite higher US yields. However, this rise in US yields came with heightened market volatility, favouring safe haven currencies such as the yen and franc.Indeed, both...
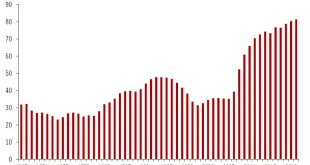
Read More »Europe chart of the week – Business surveys
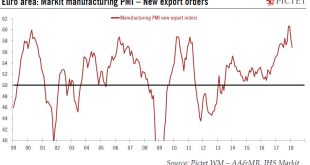
Latest business surveys surprise on the downside, but still indicate that economic expansion remains strong.There was a broad-based setback in euro area business surveys in February, whether in terms of country or of sector. The Flash composite PMI slipped to 57.5 in February from 58.8 in January. The month-to-month dip was the biggest since 2014.National business surveys painted a similar picture. In Germany, the Ifo business climate index dropped by 2.2 points to 115.4 in February, from an...
Read More »Latest US tax bill could alter trade statistics
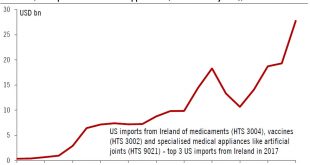
Reforms to the rules governing offshore profits will have an impact on trade stats with other countries, especially Ireland.The US tax bill, enacted last December, could lead to dramatic changes in US international trade statistics – and particularly a lower trade balance, although it is not exactly certain to what extent. Indeed, alongside the tax bill’s headline cut of the statutory corporate tax rate from 35% to 21%, it contains some important reforms to the rules governing US...
Read More »Euro area: Flash PMI surveys pass their peak
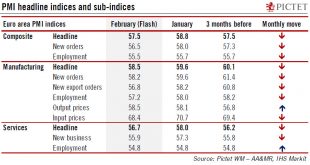
In spite of some cooling in forward indicators, euro area growth should remain robust this year.Flash PMI indices eased in February, but remain consistent with continuing solid growth in the euro area.The flash composite purchasing managers’ index (PMI) for the euro area fell to 57.5 in February from 58.8 in January, below consensus expectations. Activity in both services and manufacturing cooled in February.While the average composite PMI is pointing to an acceleration in growth in Q1, the...
Read More »Frankfurt, we have a gender problem

Increasing expectations that Germany’s Jens Weidmann will become the next ECB president are opening up gender equality issues. Change in the ranks of the central bank’s top brass is in the air.The Eurogroup has designated Spanish finance minister Luis de Guindos as candidate for the position of Vice President of the European Central Bank to succeed Vítor Constâncio in June 2018, for a non-renewable eight-year term. This nomination has increased expectations that Bundesbank President Jens...
Read More »US federal budget update—free hugs
Nudged by the White House, Congress is in fiscal easing mode in the belief that the US economy needs further stimulus. Meanwhile, some medium-term debt issues remain unaddressed.Washington DC is in fiscal easing mode. Having voted for bold tax cuts in December, Congress is now increasing the theoretical spending limits for this year and next, by USD 300bn. This comes even though budget data for the past two years have been disappointing notwithstanding a solid labour market.From a growth...
Read More »Europe chart of the week – French unemployment
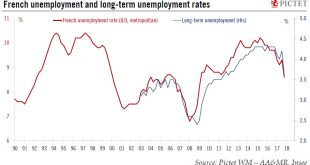
French unemployment fell surprisingly fast in Q4 2017, to a new cyclical low.France registered the largest drop in unemployment in about ten years in Q4 2017. In metropolitan France, the number of unemployed fell by 205,000 to 2.5 million people, pushing the ILO unemployment rate down to 8.6% of the labour force (-0.7pp), its lowest level since Q1 2009. The improvement was broad based across age groups and worker categories.It would be tempting to relate this spectacular drop in unemployment...
Read More »