USD/CHF stays above 10-DMA for the first time in three weeks. 50% Fibonacci retracement can guard immediate upside ahead of 0.9885/90 resistance confluence. A downside break below 61.8% Fibonacci retracement can recall monthly low. Following its break of 10-Day Simple Moving Average (DMA) on Friday, USD/CHF trades around 0.9830 during early Monday. The pair remains positive above 61.8% Fibonacci retracement of August-October upside. In doing so, 50% Fibonacci retracement, at 0.9845, can please short-term buyers. Though, a confluence of 100-DMA and 38.2% Fibonacci retracement, around 0.9885/90, can stop the pair’s further upside. In a case where prices manage to stay strong beyond 0.9890, December 06 high near 0.9920 and 23.6% Fibonacci retracement around 0.9945
Topics:
Anil Panchal considers the following as important: 1.) FXStreet on SNB&CHF, 1) SNB and CHF, Featured, newsletter, USD/CHF
This could be interesting, too:
Nachrichten Ticker - www.finanzen.ch writes Die Performance der Kryptowährungen in KW 9: Das hat sich bei Bitcoin, Ether & Co. getan
Nachrichten Ticker - www.finanzen.ch writes Wer verbirgt sich hinter der Ethereum-Technologie?
Martin Hartmann writes Eine Analyse nach den Lehren von Milton Friedman
Marc Chandler writes March 2025 Monthly
Following its break of 10-Day Simple Moving Average (DMA) on Friday, USD/CHF trades around 0.9830 during early Monday. The pair remains positive above 61.8% Fibonacci retracement of August-October upside. In doing so, 50% Fibonacci retracement, at 0.9845, can please short-term buyers. Though, a confluence of 100-DMA and 38.2% Fibonacci retracement, around 0.9885/90, can stop the pair’s further upside. In a case where prices manage to stay strong beyond 0.9890, December 06 high near 0.9920 and 23.6% Fibonacci retracement around 0.9945 can challenge the bulls. Alternatively, a daily closing beneath 61.8% Fibonacci retracement of 0.9800 can drag the quote back to monthly lows nearing 0.9770. Further, August 26 low around 0.9715 can be of intermediate importance to the Bears before they target the August month bottom surrounding 0.9660. |
USD/CHF daily chart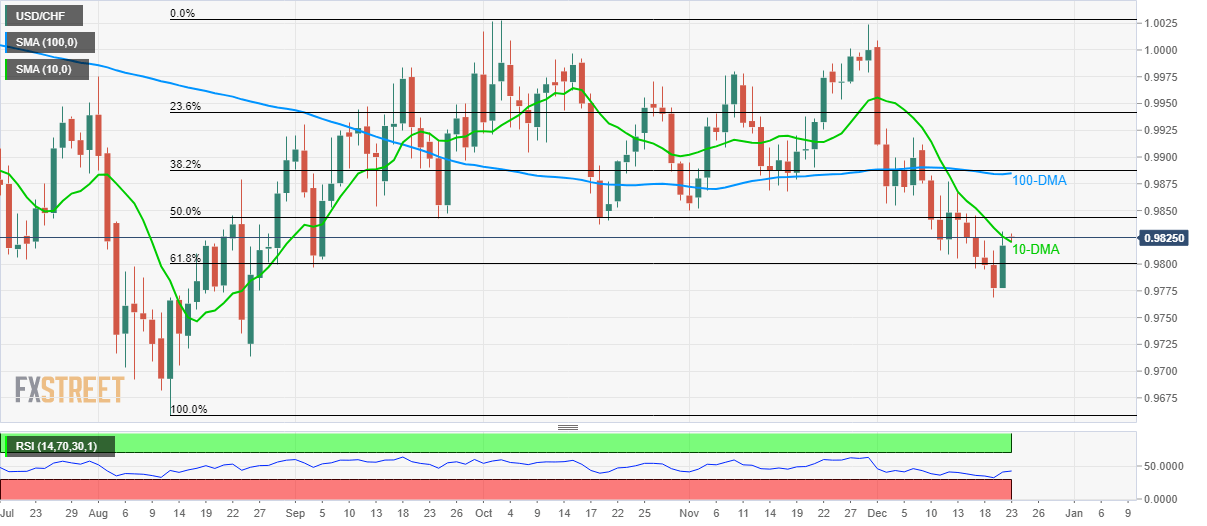 - Click to enlarge |
Trend: Recovery expected
Tags: Featured,newsletter,USD/CHF