Something happened in the credit market this week. A Barron’s article about it began: “There have been disruptions in the plumbing of U.S. markets this week. While the process of fixing them was bumpy, it was more of a technical mishap than a cause for investor concern.” Keep Calm and Carry On So, before they tell us what happened, they tell us it’s just plumbing, it’s been fixed, and that we should not be concerned. The article asserts that the reasons for the problem: “…are technical and temporary, which means investors shouldn’t worry about a credit crunch or other fundamental problems with markets and the economy.” As Obi Wan Kenobe might say, “this isn’t the credit crisis you’re looking for,” with that little hand wave that signifies the Jedi Mind Trick. The
Topics:
Keith Weiner considers the following as important: 6a.) Keith Weiner on Monetary Metals, 6a) Gold & Bitcoin, Basic Reports, central planning, Credit Crisis, Featured, Federal Reserve, newsletter, Repo, Repo Market
This could be interesting, too:
Nachrichten Ticker - www.finanzen.ch writes Die Performance der Kryptowährungen in KW 9: Das hat sich bei Bitcoin, Ether & Co. getan
Nachrichten Ticker - www.finanzen.ch writes Wer verbirgt sich hinter der Ethereum-Technologie?
Martin Hartmann writes Eine Analyse nach den Lehren von Milton Friedman
Marc Chandler writes March 2025 Monthly
Something happened in the credit market this week. A Barron’s article about it began:
“There have been disruptions in the plumbing of U.S. markets this week. While the process of fixing them was bumpy, it was more of a technical mishap than a cause for investor concern.”
Keep Calm and Carry On
So, before they tell us what happened, they tell us it’s just plumbing, it’s been fixed, and that we should not be concerned.
The article asserts that the reasons for the problem:
“…are technical and temporary, which means investors shouldn’t worry about a credit crunch or other fundamental problems with markets and the economy.”
As Obi Wan Kenobe might say, “this isn’t the credit crisis you’re looking for,” with that little hand wave that signifies the Jedi Mind Trick.
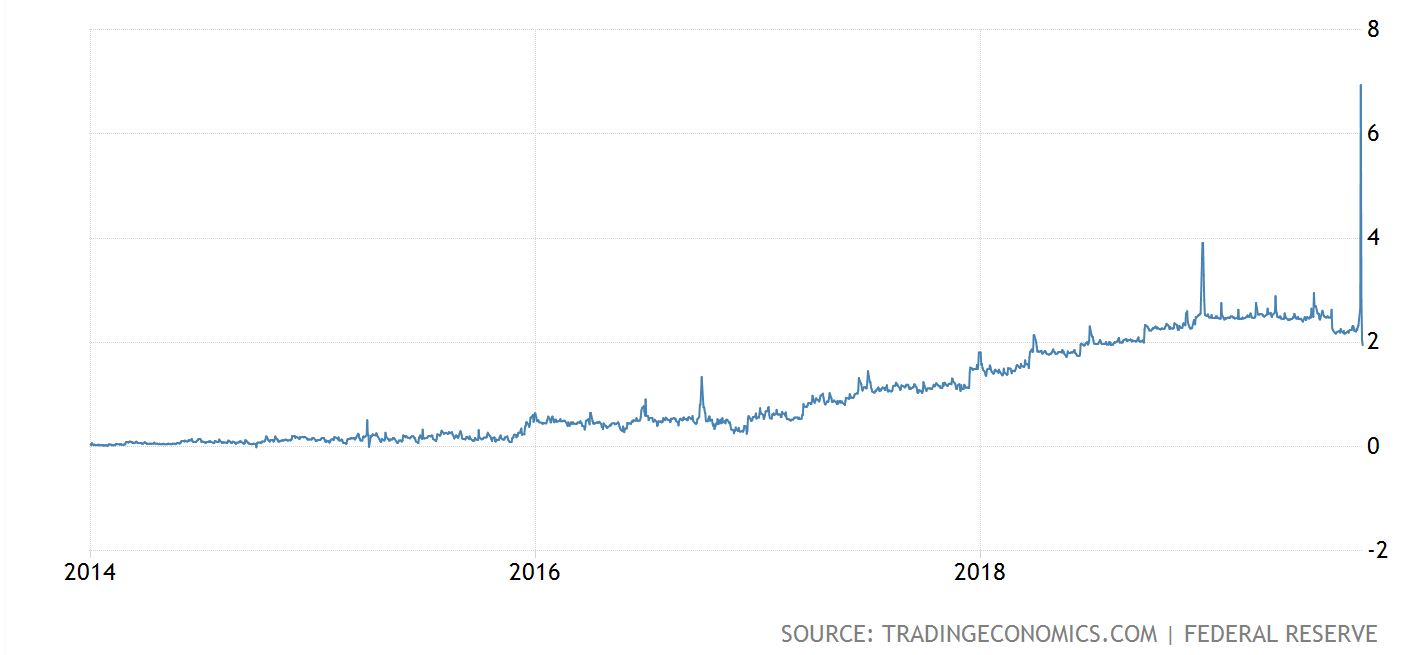
The Repo Rate SpikedLet’s look at what happened, and why it matters. The repo rate spiked. Here is a five-year graph from Trading Economics (Barrons’ says that it hit 8%, and a day or two later, we saw a report that it hit 10%). In a world of falling, zero, and negative interest rates, this is remarkable. Repo is short for repurchase agreement. In a repo, one sells an asset (e.g. a short-maturity Treasury) with an agreement to buy it back at an agreed price. It is similar to borrowing with collateral. Let’s consider an example using a house. Suppose Harry Homeowner needs cash for one day. But he doesn’t borrow $1,000,000 against his house the conventional way. Instead, he sells it to Richard Repoman. And the contract includes a provision that Harry will buy the house back tomorrow, for $1,000,100. The extra $100 is Richard’s profit, akin to interest at an annualized rate of 3.65%. Of course, repo doesn’t work with houses, because they are hard to value and not liquid. But unlike houses, the market for Treasurys is deep. And there would not be a repo market for homes in any case, because homeowners don’t usually need for cash for one day. A loan secured with a Treasury bill as collateral is as close to risk-free as anything in the financial system (Treasurys are defined as risk-free). And short-term Treasurys are generally treated as equivalent to cash. For these reasons, the spike in the rate is so strange. One key question is why would a bank need to swap some Treasurys for some dollars, and plan to un-swap them one day later? |
Repo Rate Graph, 2014-2019 |
Treasurys vs Dollars
We have noted in the past that there is an irreconcilable debate among economists on the proper definition of the money supply. There are the traditional M’s (M0, M1, M2, etc.), Money of Zero Maturity (MZM), Austrian Money Supply (AMS), True Money Supply (TMS), etc. As we said in that article, the reason for the debate and the reason why economists cannot agree, is:
Now that the dollar is irredeemable, there is a temptation to use shorthand and say that the dollar itself is money, to define money as just a medium of exchange. But if the dollar is money, what is the difference between the dollar and the bond? Both are forms of credit.
The difference is duration.
The dollar is a current asset, whereas the bond matures sometime in the future. It is interesting how much debate occurs over the question of how to define and measure the money supply. This debate occurs because everything in our monetary system is credit, and it’s hard to find a clear place to draw a line and say “this credit is money, but that credit is not money.” (One measure is called MZM—money of zero maturity.)
The dollar is the liability issued by the Fed. It issues this liability to fund its purchase of longer-duration credit assets. Why? As we said last week, the Fed earns the spread between the cost of issuing its liability and the yield it earns on its assets. This is what any bank does.
With the Treasury deemed to be risk-free, and the only real difference between a Treasury security and a dollar being the duration, it is logical that regulation generally treats Treasurys the same as cash. If a bank has $1,000,000 in Federal Reserve liabilities (i.e. dollars, i.e. cash) or if it has $1,000,000 in short-term Treasury liabilities (i.e. T-Bills), there is little practical difference.
As our financial system becomes more computerized and more sophisticated, one would expect that Treasurys could be used to settle transactions directly, without the need for dollars as an intermediary. Perhaps Harry wouldn’t pay for dinner with Treasury paper, but a financial institution should be happy to take it in payment.
Desperate Need for Cash
The opposite occurred this week, with banks so desperate to swap their Treasurys for Federal Reserve Liabilities that the price for this transaction rose to astonishing heights.
For the first time in many years, the Fed intervened in the repo market. On Tuesday, it repo’d $53 billion. And then the next day and the next, it was obliged to do more.
This means that this week, banks in aggregate abruptly needed cash buffers that are much bigger than they needed last week. It is important to understand that cash is not consumed in a transaction. If one bank pays cash to a counterparty, the cash does not go out of existence. But this week, the parties who had cash were not willing to earn a risk-free profit.
Wait. The market offers a risk-free profit, and no one is taking it? Where have we discussed this before? Oh, yeah. It is when gold backwardation becomes permanent!
The equivalent of gold backwardation has occurred in the repo market. And Barron’s (just to pick on them, other mainstream publications took the same tone) says that there’s nothing to see here, move along folks. One thing is for sure.
When the market offers a risk-free profit, there are no takers, and day after day the size of the profit grows—there is something to see.
How Did Banks Get Themselves Into This Mess?
To understand this, we need to look at the macroeconomic environment. The interest rate has been falling for about 40 years. This is so long, that few in finance or economics today were working back when rates were rising. Falling rates is presumed to be normal.
Normal or not, it puts growing pressure on the profit margins of every enterprise, including banks. When the interest rate was 10 percent, a bank could make a wide spread between what it pays to borrow and what it earns to lend. But this spread narrows as the rate falls. So banks have two responses.
One is to increase their leverage. Suppose a bank takes in $1,000,000 in deposits. If it lends $900,000 (or buys $900,000 assets), then it keeps $100,000 in cash. If the bank is paying 6 percent on average for its deposits, then its cost is $60,000. If it is lending at 10 percent, then it is making $90,000 on the part it lends out (and to keep it simple, assume nothing on the part it keeps). The difference between the two is the bank’s gross margin, or $30,000.
But if the interest rate falls, and the bank is paying 0.75% and lending at 2%, the math changes. Its cost would be $7,500 and its revenues $20,000. So its gross is now $12,500. Let’s assume that the bank employs the same number of people, and pays rent on the same square footage of retail bank branches to raise deposits as it did (the cost of compliance is actually much higher today). The bank has a big shortfall to somehow make up.
So the bank may be tempted, not to lend just $900,000 but say $990,000. By lending that additional $90,000 it adds $1,800 revenues. So it is up to $14,300. Better, but still inadequate.
The other trick is to lend for longer duration. The interest rate is normally higher on long bonds than it is on short-term bills (though we have had some inversion in recent months). Suppose the 30-year bond yield were 3.25% (it’s actually a point less right now). On $990,000, the bank earns a gross of $32,175, or a net margin of $24,675. That looks better, doesn’t it?
Of course, there are macroeconomic problems when a bank lends a higher percentage of deposits. The borrowers spend those dollars, and in an irredeemable currency system, there is no way to hold a dollar outside the banking system (even the paper bank note funds the Fed which funds the banks and the government). The recipients of those spent dollars deposit them in a bank. Which lends 99%. And so on. The quantity of what people call money goes up quite rapidly.
There are also risks to the bank itself,. Depositors have the right to withdraw deposits, but the bank does not have the right to call its loans. So if depositors want to withdraw cash, the bank may not have enough on hand. Then, it must sell assets, and take losses, even in a good market. And in times of crisis, these losses are much greater.
And there will be a crisis because the other banks are in the same situation. All attempt to sell assets, with few (or no) buyers, desperately raising cash to satisfy their creditors who are withdrawing cash and not willing to roll their credit.
Of course, the Federal Reserve is the root cause of the problem. There are always bad actors, no matter how free the market. But in the Fed’s falling-interest world, banks are forced to engage in these twin practices. People may blame the banks for greed for the last crisis (as they no doubt will in the next one), but they should look at the extreme circumstances that the central planner has created.
The Federal Deposit Insurance Corporation (FDIC) contributes its moral hazard, in effect telling depositors not to worry about bank creditworthiness. Regulators also contribute, by claiming to ensure bank soundness. The banks get, in essence, a blank check.
Macroprudential Regulation
The Fed and other regulators have an answer. It’s a special magic called macroprudential regulation. This is a case of compensation—deliberately doing the wrong thing, purportedly to fix something else that one cannot or does not wish to fix the right way. Like letting the air out of three tires, when one has a flat.
Or like imposing macroprudential regulation, when one has a falling interest rate regime prone to crises.
The root cause of crisis is the consumption of capital, which is enabled and incentivized by the falling interest rate regime. John Maynard Keynes said to drive interest to zero to kill the savers. And he smirked that not one in a million can diagnose what’s happening. That is because the process of driving interest to zero is an endless bull market. The price of an asset is the inverse of the interest rate.
We are siphoning off capital, to consume it in a so-called wealth effect. This is bound to cause crises in the financial system, and threaten the financial intermediaries. As more and more capital is consumed, and the price of a unit of capital skyrockets, the system becomes unstable and the moving parts are put under greater stress.
The compensator-central-planners keep tamping down here, boosting there, and increasing the quantity of what they call money.
The Mad Kraken
An image that comes to mind is a mad ocean monster, like a kraken. It is blasting a sea dike with many high-pressure hoses. This causes leaks, but the kraken keeps plugging them with more and more tentacles. We call it a strong economy so long as the tentacles are one step ahead of the 1000PSI water jets. Sometimes a leak will be missed, and the whole dike is being undermined by so much erosive water blasting.
We can think of two reasons why banks needed to swap Treasurys for cash. Last week, there was a greater amount of Treasury bond issuance. Unlike in a transaction between banks, when a bank pays cash to the US Treasury to buy a bond, the cash goes out of the banking system until Treasury spends it with a lag. So when net Treasury bond issuance is rising, there is a net drain of liquidity from the banking system.
Also, of course the Treasury obviously cannot accept its old paper as payment for purchase of new paper! To do that would risk shining too much light on the shabby little secret of the monetary system. The Treasury bond is payable only in Federal Reserve Notes, which are backed only by Treasury paper, which is payable only…
The second reason is macroprudential regulation. Under most bank regulation, there is no difference between holding Federal Reserve liabilities and Treasury liabilities. If a bank has reserves on deposit at the Fed, or if it has short-term Treasury bills, its capital ratios are the same.
But as part of the sweeping regulations that were enacted in the wake of the 2008 crisis, there is one area where the two are not equivalent. Banks deemed too big to fail are required to have a plan of how they could be wound down in a crisis. For purposes of this wind-down process, they need to have cash—Federal Reserve liabilities only. Treasurys will not do, because the assumption is that in a crisis there may not be an orderly market or a buyer. And the bank is required by regulation to be able to fund its needs for 30 days until it can be wound down or the Federal Kraken can slap another tentacle on whatever leaking hole is causing that particular crisis symptom.
The proximate cause of the crisis this week is that settling purchases of Treasurys drained cash. Banks assumed they could raise the cash in the repo market as they always had. But this measure of so-called resolution liquidity forces the banks who have cash not to lend it. Not even when a Treasury is offered in repo.
So the Fed jumped in, offering tens of billions of dollars in repo. We have read that there was more demand than the Fed expected—more bank stress.
We have no doubt that the Fed will plug this hole with its repo tentacle. That’s what the Fed is supposed to do. This proximate action will oppose the proximate cause of the crisis. The banks desperately need more cash, and the Fed will desperately pump it.
This visual analogy suggests that the very act of fixing the problem threatens to cause another problem! The Fed will pump, but what hole will this drill?
For one thing, it will give banks the confidence to buy Treasurys (and perhaps other higher-yielding assets). Macroprudential regulation reins them in, saying “no no no, you cannot buy more assets you must keep cash”. But this led to a crisis this week. So Fed repo undoes this, saying “yes yes yes, you can and we will repo those Treasurys if you need the cash to satisfy your requirements for resolution liquidity.”
Will macroprudential regulation and Fed repo exactly cancel each other, with no other side effects? Does cocaine exactly cancel sleep deprivation? Does driving 120 miles per hour exactly counter leaving late for work? Does high resolution cinematography exactly cancel bad story writing? Does letting the air out of three tires exactly cancel a flat tire?
Fed repo will alleviate this particular symptom. And help pave the way for the next crisis.
Supply and Demand
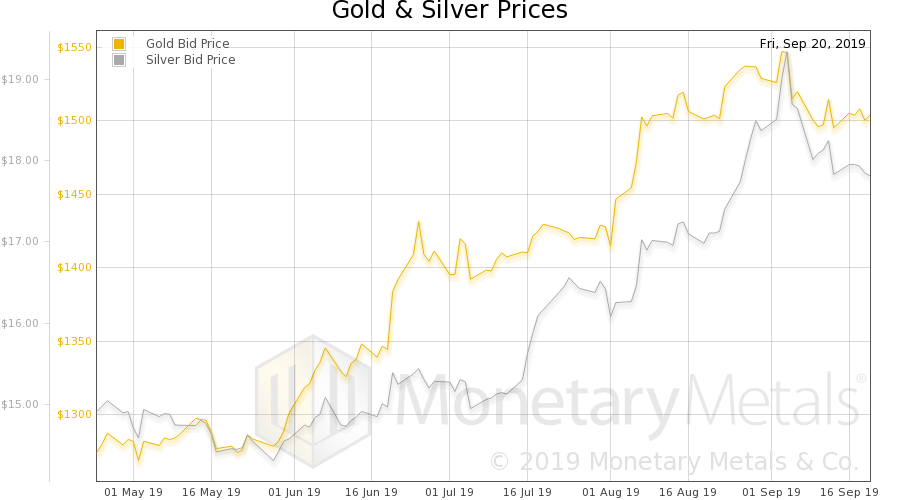
The price of gold rose $28, and silver $0.53.
But the prices of the metals was not the big news this week. The price of repo—a repurchase agreement, to sell and repurchase a Treasury—skyrocketed. Banks were thirsty for liquidity, and only cash can quench it. Just another day in the fool’s paradise of centrally planning an irredeemable currency and its interest rate. Just another crisis, to be tamped down by the central planner. Keep Calm and Carry On.
This is a curious phenomenon, where the market is offering a risk-free trade to give up one’s dollars and get them back tomorrow plus a return. Yet no bank or other trader is taking the bait. As we explain above, the problem is not a shortage of trust but of liquidity.
When trust in the system collapses, then gold will withdraw its bid on the dollar (which most people will mis-perceive as the disappearance of offers to sell gold). This will be permanent gold backwardation.
So the question that should be on everyone’s mind is: did we drop into gold backwardation this week? Or silver? Read on to see graphs of the gold and silver cobasis (backwardation is strictly when cobasis > 0).
Gold and Silver PricesBut first, let’s look at the only true picture of the supply and demand fundamentals. But, first, here is the chart of the prices of gold and silver. |
Gold and Silver Prices(see more posts on gold price, silver price, ) |
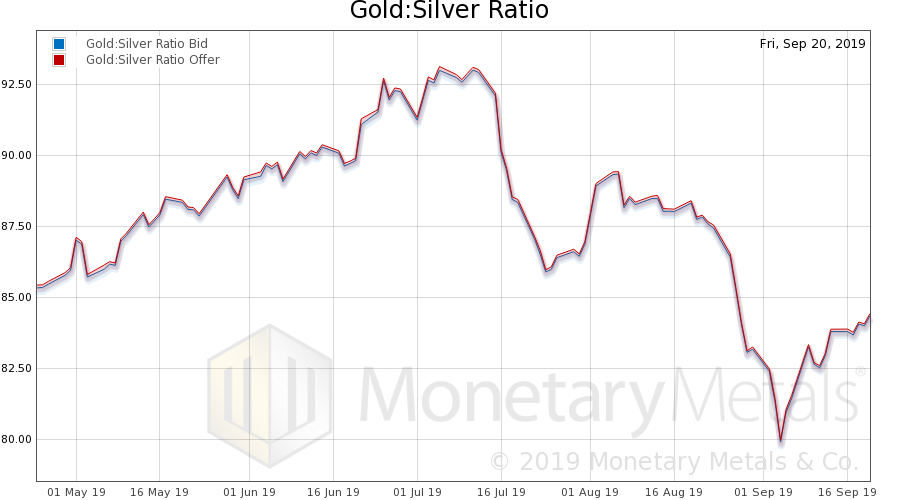
Gold to Silver RatioNext, this is a graph of the gold price measured in silver, otherwise known as the gold to silver ratio (see here for an explanation of bid and offer prices for the ratio). The ratio rose fell (the chart values are Arizona morning time, whereas we are discussing the weekly close). |
Gold: Silver Ratio(see more posts on gold silver ratio, ) |
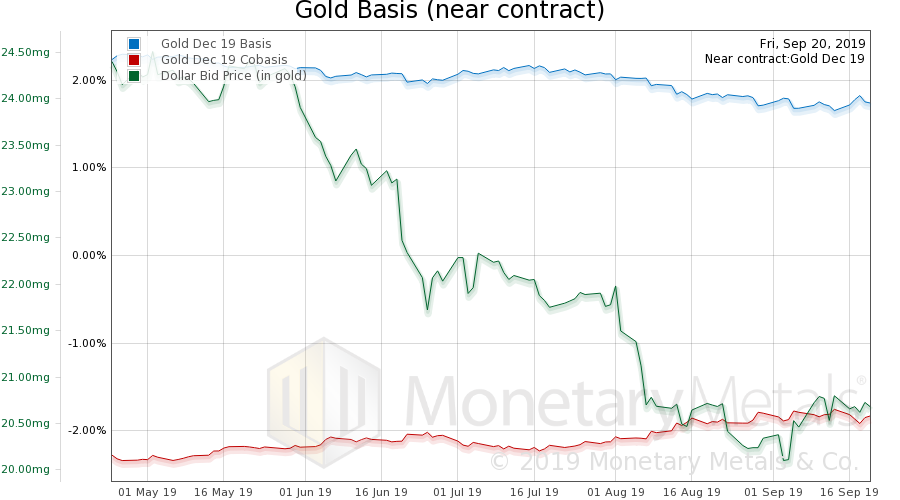
Gold Basis and Co-basis and the Dollar PriceHere is the gold graph showing gold basis, cobasis and the price of the dollar in terms of gold price. Not even the near contract is backwardated. And the gold basis continuous is not backwardated either. They’re both around -2%. Conversely, the basis is just a bit under 2%. Gold is so abundant, that one can buy the metal and simultaneously sell it forward, to earn an annualized return of around 2%. Whatever the ramifications of the repo crisis, they do not yet include systemic trust concerns. We do not expect the repo problem, in itself, to lead to such concerns or gold backwardation. The Monetary Metals Gold Fundamental Price fell $6, to $1,492. |
Gold Basis and Co-basis and the Dollar Price(see more posts on dollar price, gold basis, Gold co-basis, ) |
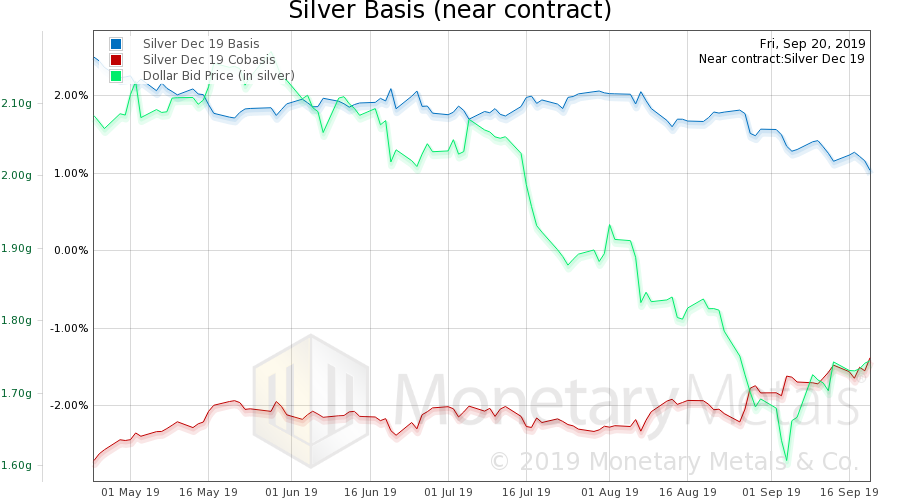
Silver Basis and Co-basis and the Dollar PriceNow let’s look at silver. In silver, we also see the absence of backwardation (though the cobasis is a bit higher). The Monetary Metals Silver Fundamental Price dropped 7 cents, to $17.92. © 2019 Monetary Metals |
Silver Basis and Co-basis and the Dollar Price(see more posts on dollar price, silver basis, Silver co-basis, ) |
Tags: Basic Reports,central planning,Credit Crisis,Featured,federal-reserve,newsletter,repo,repo market

