The economic data over the last month continued to improve but the breadth of improvement has narrowed. Additionally, while most of the economic data series are still improving, the rate of change, as Jeff pointed out recently, has slowed. I guess that isn’t that surprising as the initial phase of the recovery comes to an end. 2nd quarter was a giant downdraft and 3rd quarter saw an initial rapid climb out the giant hole dug by the shutdowns (an own goal of epic proportions in my mind, but I try not to get into politics on our work site so that’s all I’ll say). But even after that initial acceleration out of deep recession, we remain well below where we were when all this started. A slowing of the recovery is okay and expected; a complete truncation is not. When
Topics:
Joseph Y. Calhoun considers the following as important: 10 year treasury note yield, 5.) Alhambra Investments, Alhambra Research, bonds, commodities, copper/gold ratio, currencies, economic growth, economic recovery, economy, election 2020, existing home sales, Featured, Federal Reserve, Gold, housing, Housing Starts, inflation targeting, Interest rates, Markets, New Home Sales, newsletter, real yields, stocks, TIPS, US dollar, Yield Curve
This could be interesting, too:
Nachrichten Ticker - www.finanzen.ch writes Die Performance der Kryptowährungen in KW 9: Das hat sich bei Bitcoin, Ether & Co. getan
Nachrichten Ticker - www.finanzen.ch writes Wer verbirgt sich hinter der Ethereum-Technologie?
Martin Hartmann writes Eine Analyse nach den Lehren von Milton Friedman
Marc Chandler writes March 2025 Monthly
The economic data over the last month continued to improve but the breadth of improvement has narrowed. Additionally, while most of the economic data series are still improving, the rate of change, as Jeff pointed out recently, has slowed. I guess that isn’t that surprising as the initial phase of the recovery comes to an end. 2nd quarter was a giant downdraft and 3rd quarter saw an initial rapid climb out the giant hole dug by the shutdowns (an own goal of epic proportions in my mind, but I try not to get into politics on our work site so that’s all I’ll say). But even after that initial acceleration out of deep recession, we remain well below where we were when all this started.
A slowing of the recovery is okay and expected; a complete truncation is not.
When all this started is an interesting point too. Obviously, the economy took a big hit from the virus, but the slowdown long predated the 2nd quarter of 2020. Year-over-year per capita GDP growth peaked in the 2nd quarter of 2018. That growth had fallen by nearly half by the 2nd quarter of 2019, a slowdown that both Jeff and I wrote about repeatedly in 2018 and 2019. Indeed, Jeff first started seeing problems in the Eurodollar market way back in May of 2018 (see here, here, here and here) and even earlier in the fall of 2017.
Problems in the global economy show up in the Eurodollar markets first, which is why Jeff pays so much attention to it. Everyone remembers the US yield curve inversion in the US in August of 2019, a precursor to every recession in recent history. But Jeff noted a different kind of inversion in the Eurodollar market much earlier in 2018 (see here). Yes, it was early and stocks had a great 2019 but as I’ve said many times, the economy and stocks are rarely on the same page. The world’s bond and money markets though are usually ahead of the popular narrative – and the Fed’s – about the economy. Markets look forward, data – and the Fed – looks backward. And the Eurodollar market is the early warning system of the global money markets.
I’ve said many times that at Alhambra we don’t try to predict the future because it is impossible. We just observe markets and report the trends. As Jeff noted yesterday, we are seeing a little dollar tightening right now, but it is small and hard to determine a cause. The recent rise in the dollar and the fall in gold may be pointing to funding issues, but it could also be something more benign. I would just add to Jeff’s comments from yesterday by pointing out that we have seen a rise in real (TIPS) yields that corresponds with the dollar and gold moves. That might point to another cause which Jeff has written about recently – the Fed’s complete belly flop at Jackson Hole.
Powell promised at Jackson Hole to allow inflation to run above the Fed’s alleged target of 2% if and when it gets there. What Powell didn’t say was how the Fed will get inflation up to that 2% target much less above it. And neither has any of the plethora of Fed officials out on the road trying to make this thing stick. There’s no there there. And so, maybe the move in real yields, gold, and the dollar is more about investors deciding that if the Fed isn’t going to do anything maybe they don’t need to be hedging against an inflation that so far hasn’t arrived despite the vast expansion of the Fed’s balance sheet.
In fact, we have precedence for that view going back to the last peak in gold in 2011. Everyone thought QE was money printing, that the dollar had to fall and they bid gold to $2000 by mid-July. Remember the economists’ Op-Ed in the Wall Street Journal warning about inflation? Yeah, didn’t happen. Gold hit its peak in September of 2011 and then traded sideways until 2013, when real yields started to rise. And when real yields did rise starting in early 2013, it was look-out-below for gold as it fell by nearly half by the low in late 2015. The dollar didn’t really take off to the upside until 2014 so these things aren’t always exactly coincidental but they are all related.
This year, the 10-year TIPS yield hit its nadir on August 6th at -1.08% and gold peaked the very next day. That is not a coincidence. Since then, real yields have risen to 92 basis points, a 16 basis point move that seems minor, but may be speaking volumes. With nominal yields essentially flat, that means we’ve seen a drop in inflation expectations over the last month which fits perfectly with a firming of the dollar and a selloff in gold. You never know the exact cause of these things until after the fact, so this could still turn out to be collateral issues. But it could also just be an acknowledgment by the market that inflation just isn’t a threat.
Selected Economic ChartsI said above the breadth of the recovery has narrowed and it has. The recovery on the production side of the economy is moderating which you can see in the industrial production numbers: |
US Industrial Production Index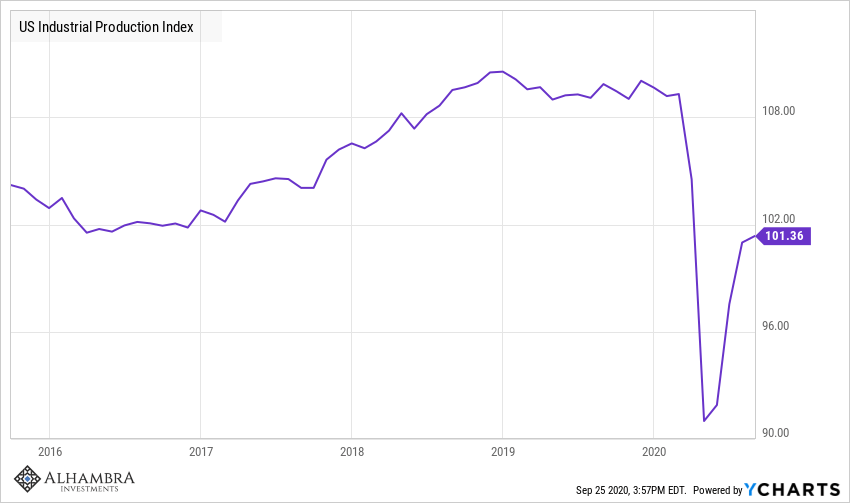 - Click to enlarge |
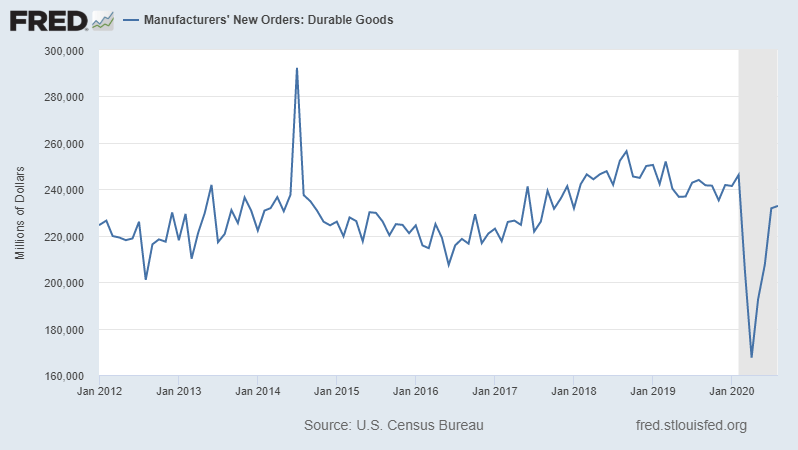
| And also in the Durable Goods orders released Friday:
The outlier, the one area that is unambiguously strong, is real estate. The housing market is on a roll with both existing and new home sales hitting highs not seen since before the 2008 crisis: |
 . |
| US Existing Home Sales data by YCharts |
US Existing Home Sales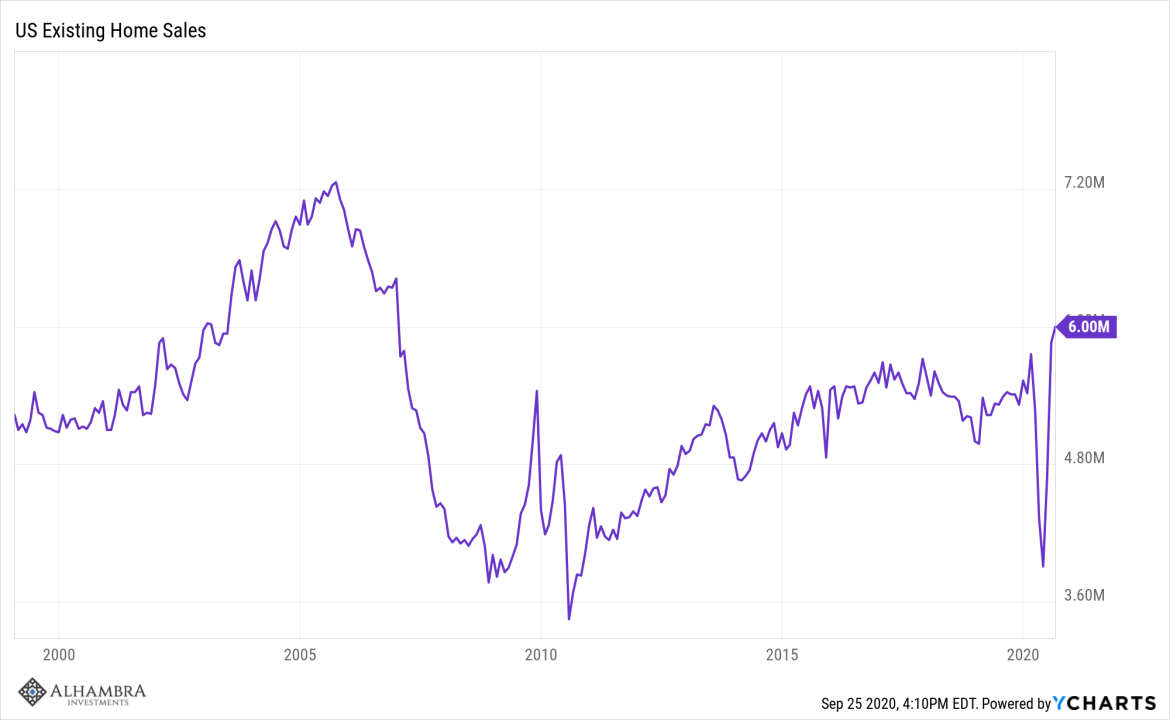 - Click to enlarge |
| US New Single Family Houses Sold data by YCharts
This is not, however, as good a news for the economy as it might first appear. Existing home sales have an impact on the economy but it is mostly in the form of sales of home goods – refrigerators, washers, dryers, and furniture, etc. But we just saw that the recovery in durable goods orders is already moderating so the impact might not be that great. On new home sales, it is construction that really affects GDP and on that score, the news isn’t as hopeful. Housing starts are only up slightly from last year. Homebuilders appear to be wary of building inventory and are only building to meet current demand: |
US New Single Family Houses Sold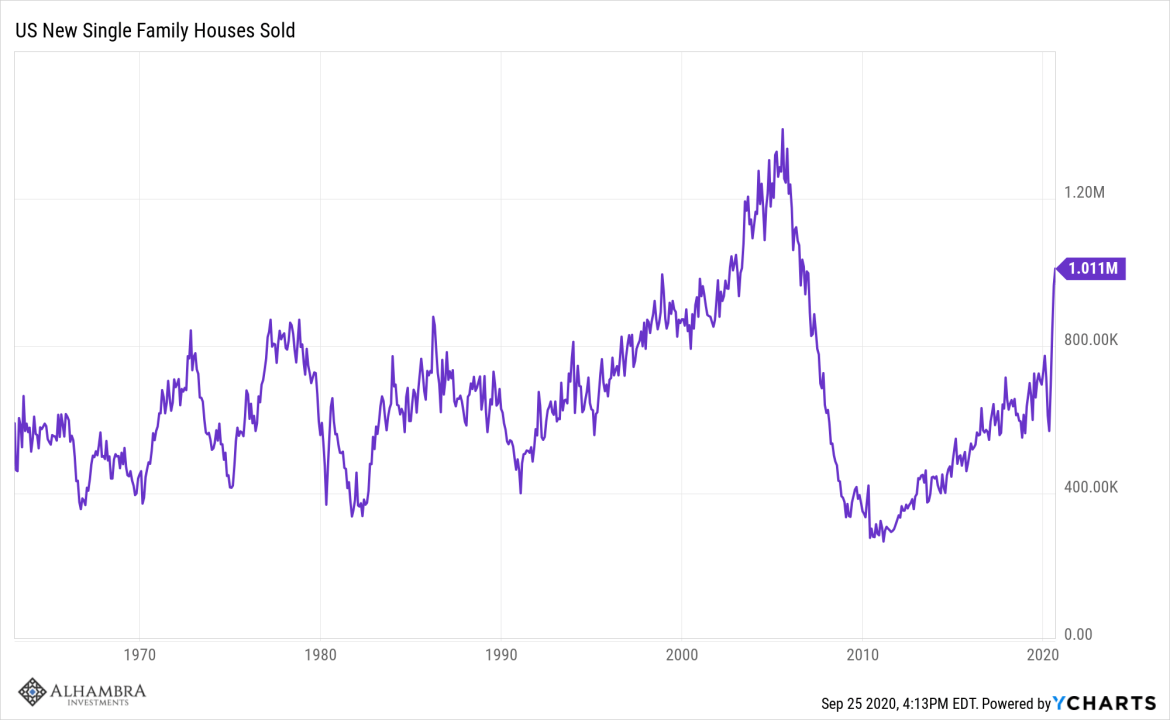 - Click to enlarge |
| US Housing Starts data by YCharts
So, yes, housing is going gangbusters right now, but for it to really impact the economy it will have to continue for a while. We should also consider the impact of putting all or most of our investment eggs in the residential basket. Building houses may goose GDP in the short term, but it is kind of like eating our seed corn. Houses are not productive assets so while it is classified as investment in GDP terms, it really doesn’t move the needle on productivity, which is where future growth is built. We’ve seen this movie before and it doesn’t turn out well. There is potentially some good news for future production in the inventory numbers where inventory/sales ratios are hitting levels last seen in 2014. |
US Housing Starts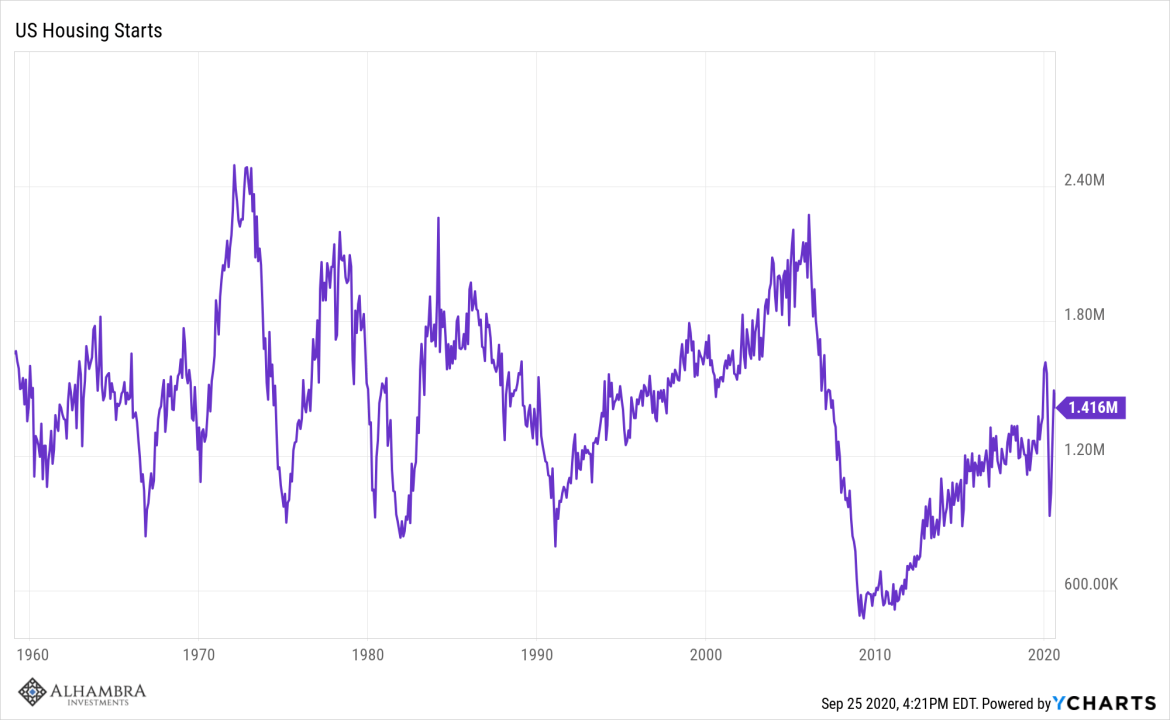 - Click to enlarge |
| Caution is warranted though, since these are July numbers and as Jeff has been pointing out, that month is looking like a peak in the rate of change. Theoretically, low inventory/sales ratios mean production will be ramped up to rebuild inventories. But I’m a bit skeptical of that since no one really knows where things are headed with this virus. I’d expect wholesalers and retailers to keep things lean until they have more visibility on sales. |
US Business Inventory/Sales Ratio - Click to enlarge |
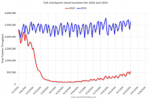
Market Indicators10-Year Treasury YieldThe 10-year Treasury note yield continues to flatline. Forget the economic data. The 10 year says economic growth is going nowhere. |
10-Year Treasury Yield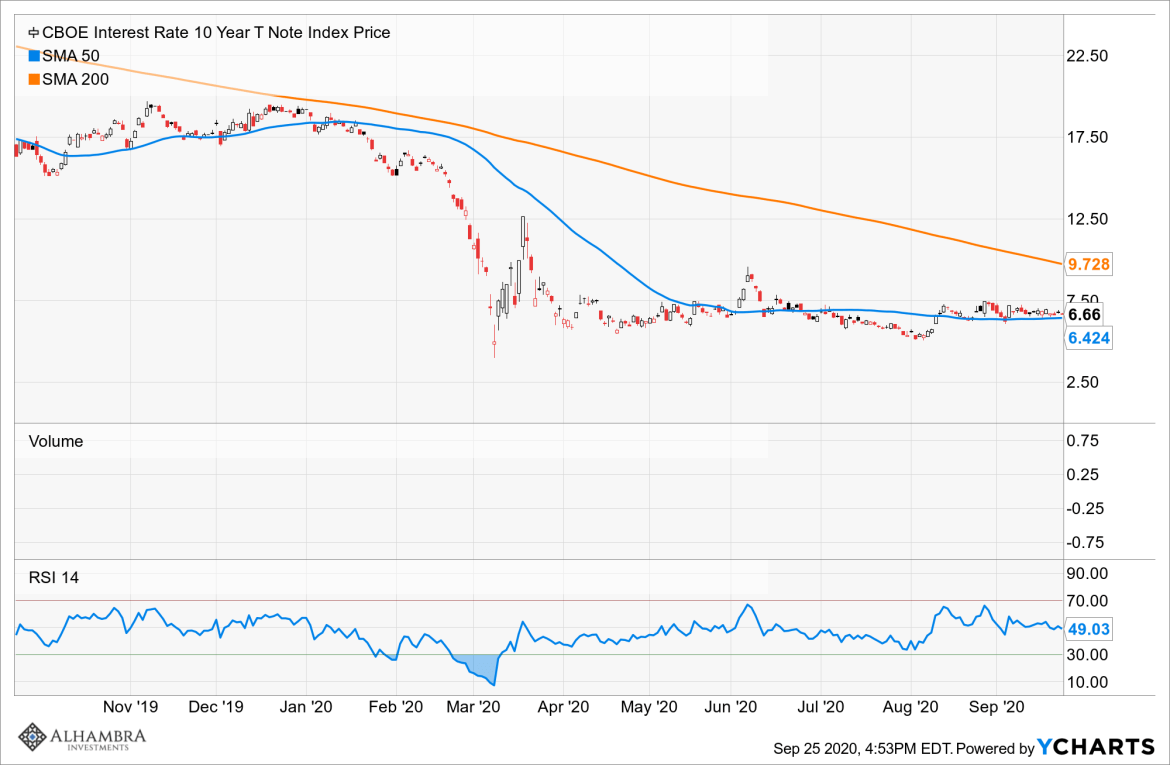 - Click to enlarge |
10-Year TIPS Yield10-year TIPS yields have come off their lows, which means a slight rise in real growth expectations. From an investor behavior standpoint, it is simpler than that. TIPS rallied (yields fell) because people were worried about inflation. That is likely a reaction to the Fed and a huge deficit but the reason really doesn’t matter. When people are worried about inflation they buy protection, and TIPS are designed for exactly this purpose. As people’s fears about inflation eased, they sold their TIPS positions. What does it mean? Not a lot right now. 10 Year Treasury Inflation-Indexed Security Rate data by YCharts |
10 Year Treasury Inflation-Indexed Security Rate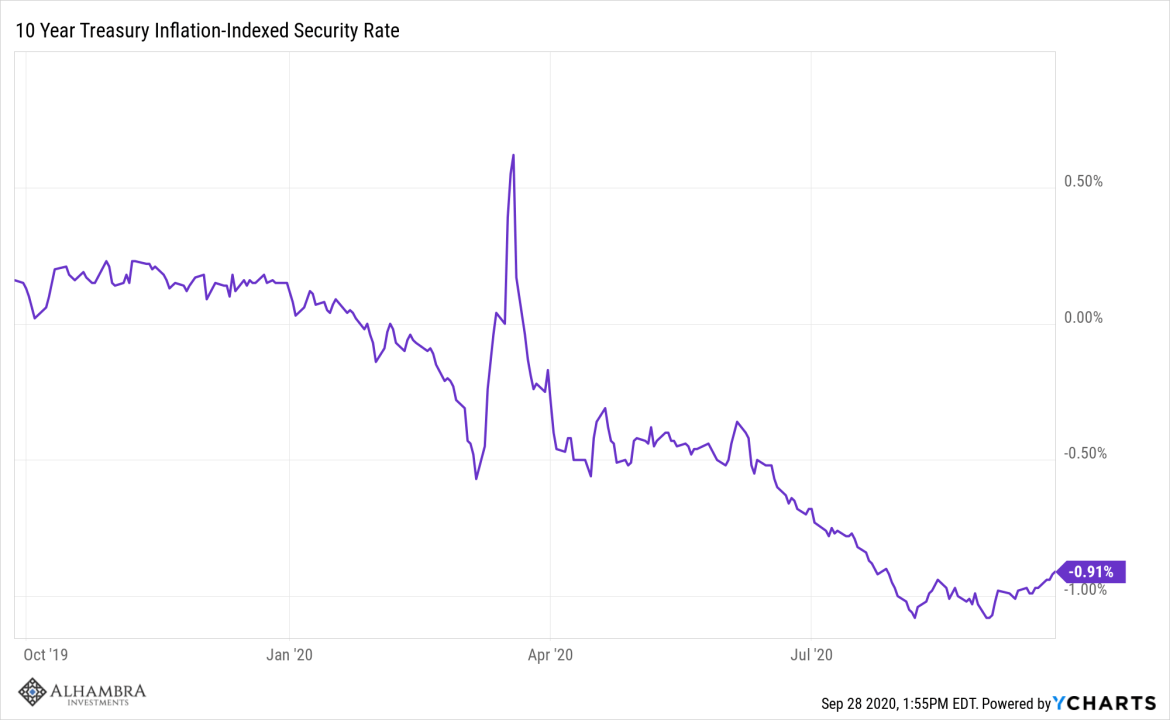 - Click to enlarge |
Inflation ExpectationsA rise in real yields with nominal yields staying roughly the same means a decline in inflation expectations. Again, a small move that doesn’t mean anything yet. |
10 Year TIPS/Treasury Breakeven Rate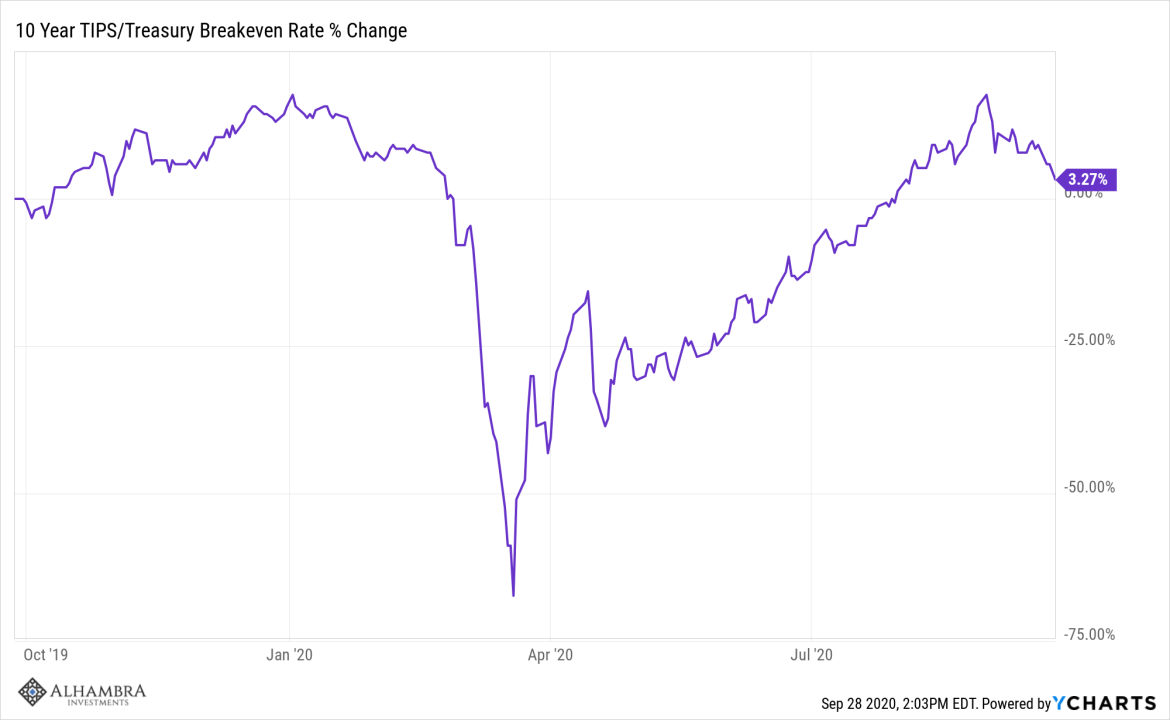 - Click to enlarge |
2-Year Treasury Yields2-year Treasury note yields are unchanged since July. I expect to be writing that statement for quite a while. 2 Year Treasury Rate data by YCharts |
2 Year Treasury Rate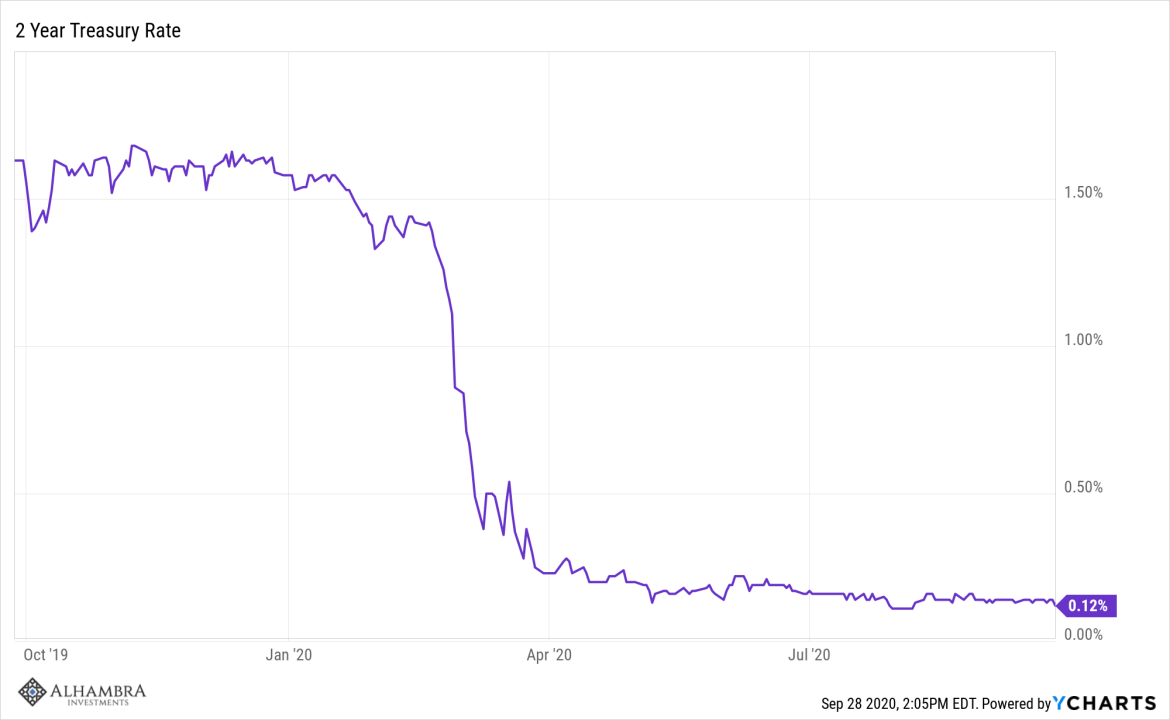 - Click to enlarge |
Yield CurveThe 10/2 Treasury yield spread has been stuck around 50 basis points since March. Normally, we would expect the curve to steepen during the recession. That has happened in every recent recession as short rates fall faster than long rates. But that is going to be very hard today since short rates are pegged near zero. The natural question is whether a steep yield curve is required for a recovery. If it is, then we may have a problem. The only way for the curve to steepen now is for growth expectations to rise (10-year rate rise). You see the problem? If a steep curve is required for recovery how will growth expectations rise if the curve never steepens? I don’t have an answer to that question but I guess we will find out in due course. |
10-2 Year Treasury Yield Spread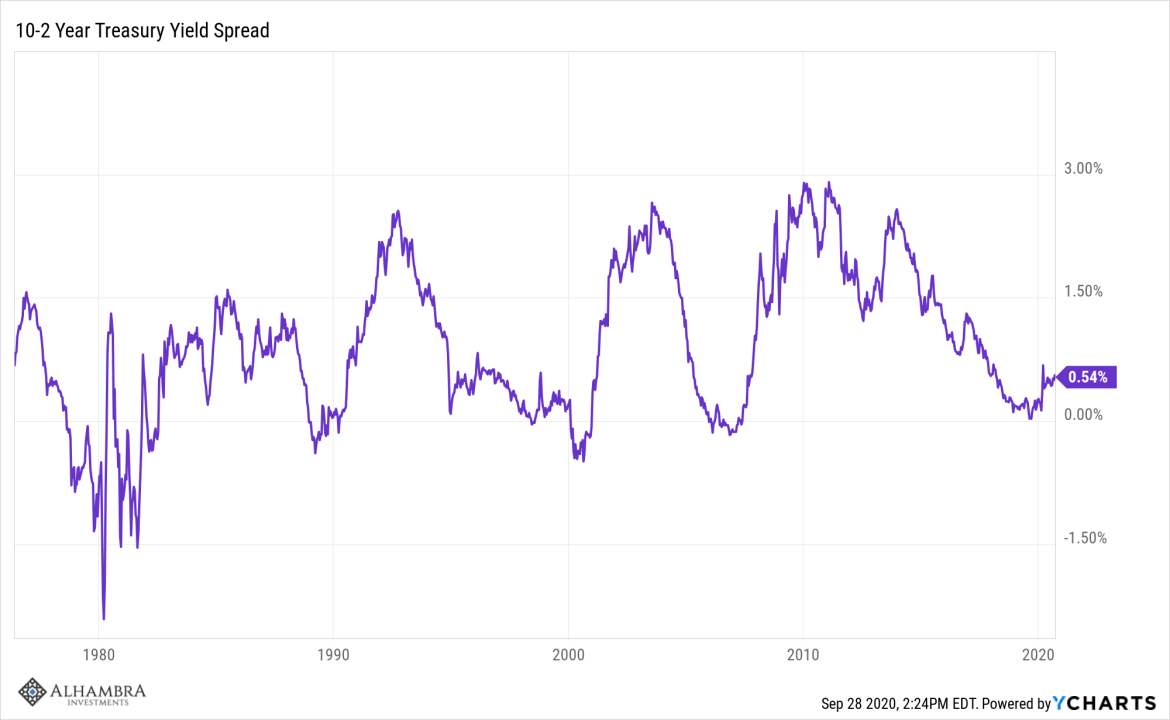 - Click to enlarge |
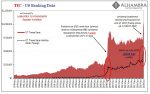
Credit SpreadsCredit spreads have recently widened slightly which is a cause for at least mild concern. Rising spreads are usually a sign of waning risk appetite but in this case, it may just be indigestion. High yield issuers have been very active with junk issuance setting a record this year. High supply appears to be meeting more tepid demand. US High Yield Master II Option-Adjusted Spread data by YCharts |
US High Yield Master II Option-Adjusted Spread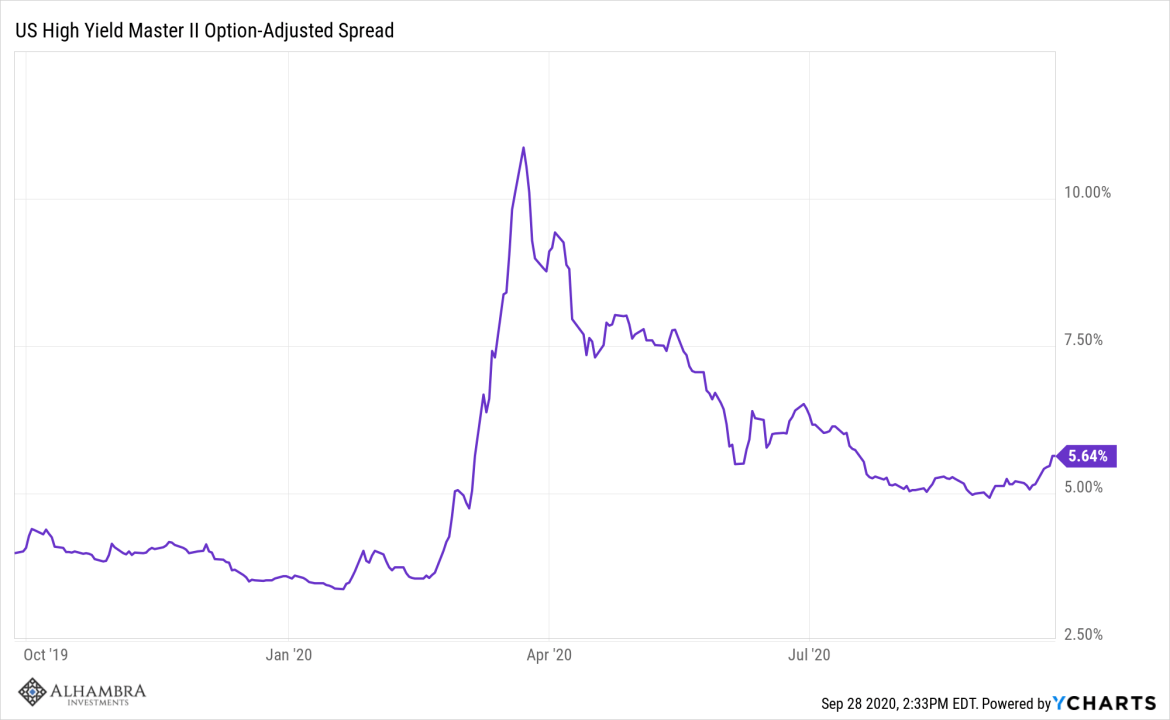 - Click to enlarge |
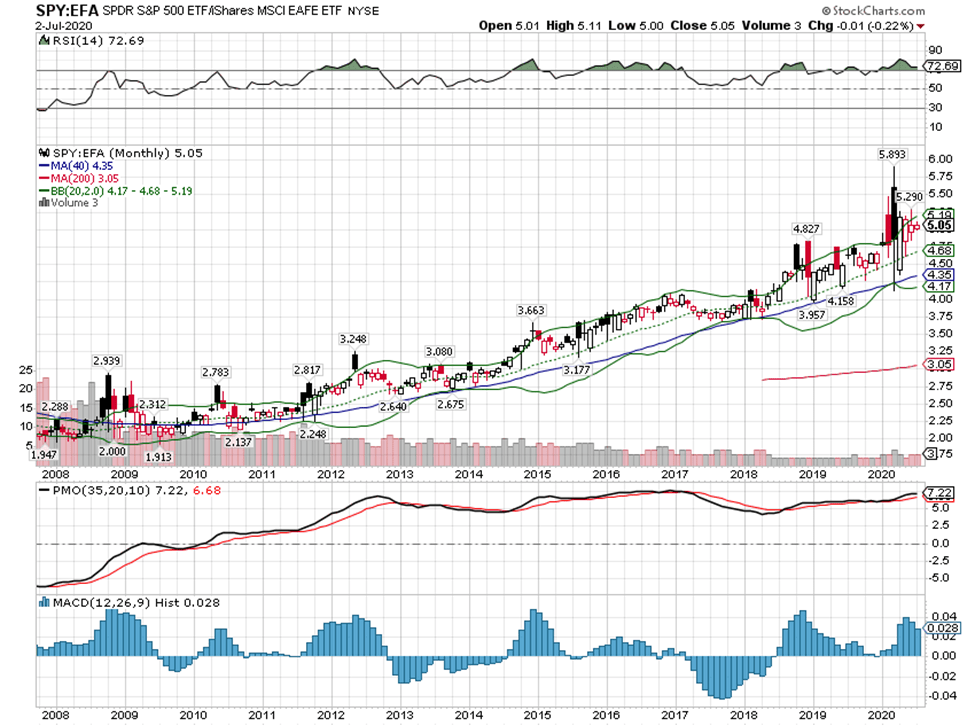
US DollarThe dollar has come off its recent lows but the move so far doesn’t mean much. The dollar has been trending lower since the peak in March but as I’ve said before it remains fairly strong relative to where it was in 2014. Since 2015 though, the broad dollar index is just trending sideways within a broad range. It is against EM currencies, including the Chinese Yuan, where most of the damage of a strong dollar has been felt. Our portfolios are tilted toward weak dollar investments right now because the 3,6,9 and 12-month rates of change on the dollar index are all negative. That could change of course and if it does, our portfolios will change. But until it does, this is a mildly weak dollar environment. |
US Dollar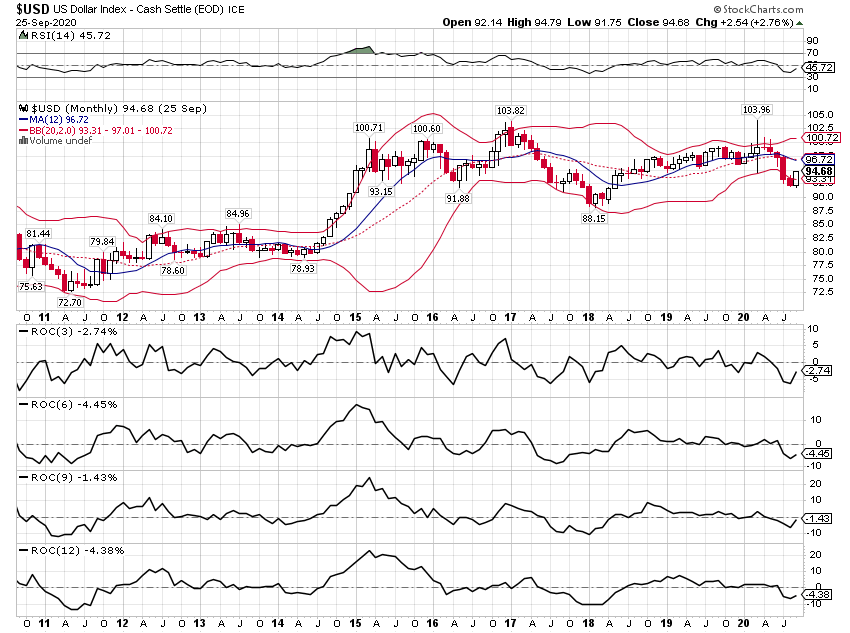 - Click to enlarge |
GoldGold peaked in early August and has now corrected roughly 10%. Where it goes from here is dependent on real interest rates. If growth expectations rise and inflation concerns ease, the top may be in. I’m not sure about the growth part but at least for now, I think the inflation concerns are still overblown. By the way, while all the rates of change are negative on the dollar, they are all positive on gold so I still think of this as a bull market. |
Gold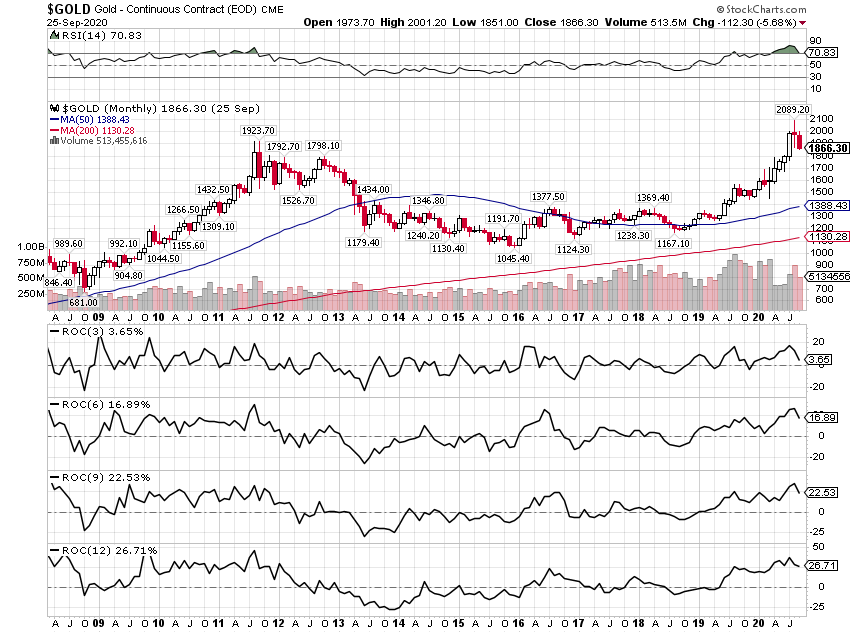 - Click to enlarge |
Commodity IndexesThe GSCI pulled back with everything else in early September but the correction may already be over. The recovery looks like it is intact. |
S&P GSCI Commodity index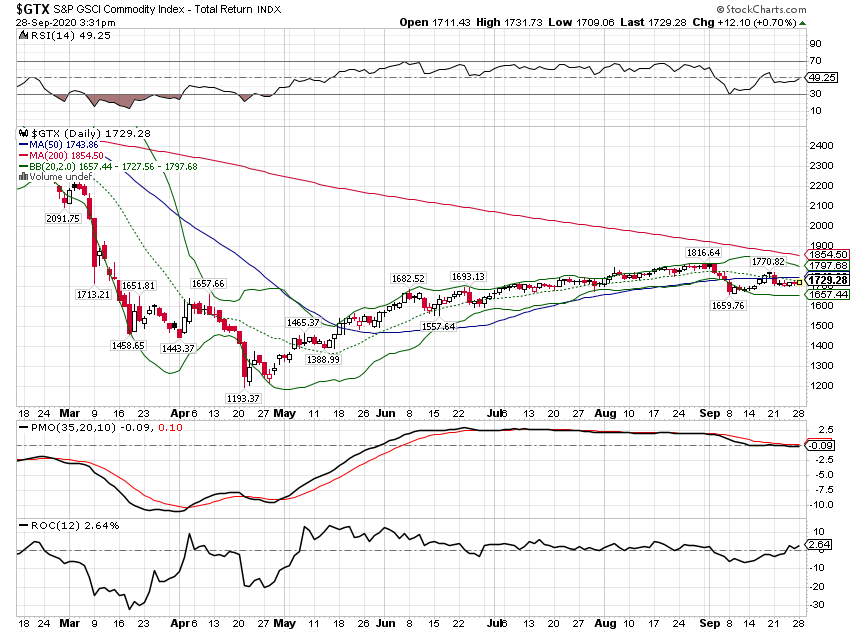 - Click to enlarge |
| Copper has also softened some but so far the correction is very mild. |
Copper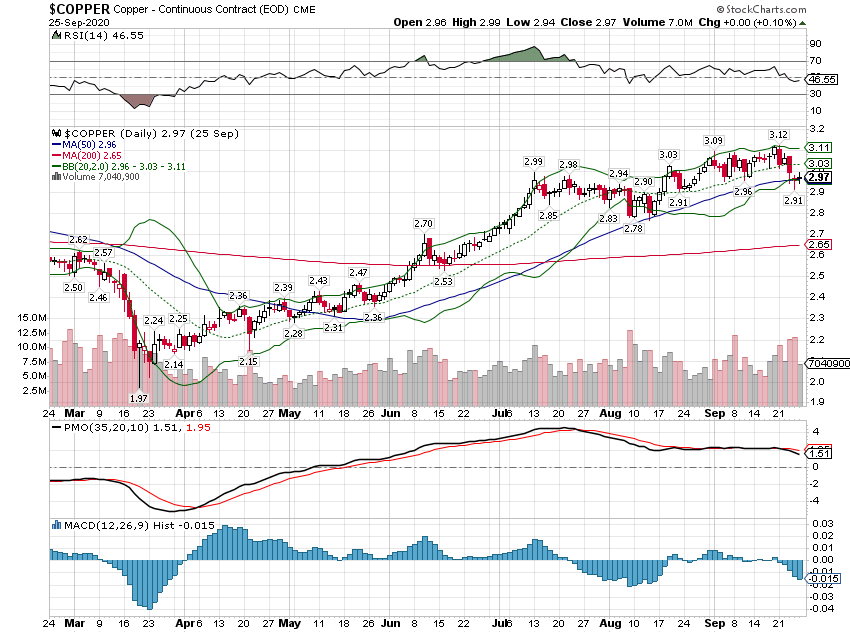 - Click to enlarge |
| The more important indicator is the copper/gold ratio which remains in an uptrend. The 10-year Treasury yield tracks this ratio almost tick for tick but the two have diverged for now. Eventually, I would expect either copper to fall or rates to rise but there is no way to know in advance which it will be. |
Copper / Gold ratio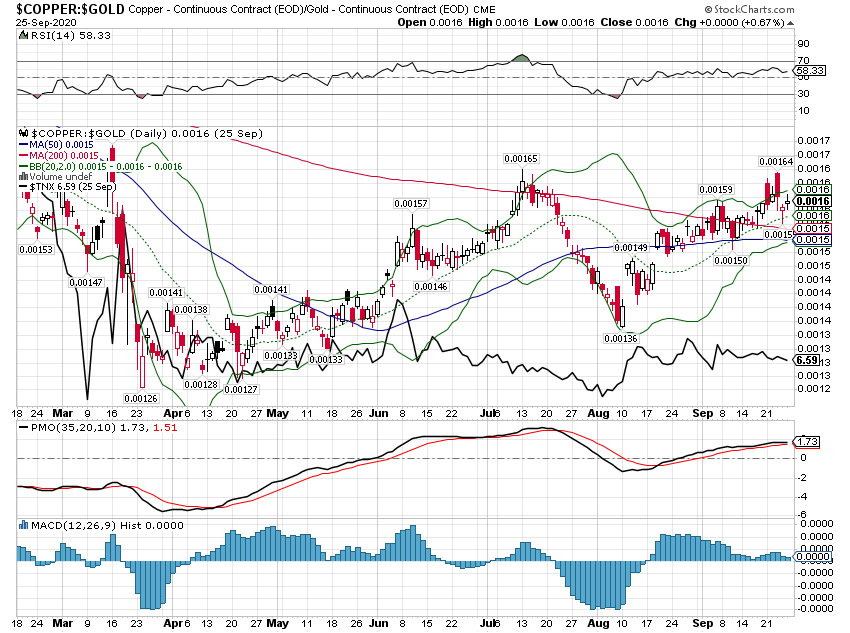 - Click to enlarge |
For now, the economic environment is marked by improving growth (but with the rate of change slowing) and a weak dollar (but mostly a short-term phenomenon). Markets are being whipsawed by politics right now, and that probably isn’t going to change in the near term. One day Pelosi and Mnuchin look like they’ll have another COVID relief bill and the next they don’t. Stocks swing with the news cycle and course of the negotiations. And of course, we have an election coming up with the first of three debates tomorrow night. How those come out could have a big impact on the election and at least theoretically, the market.
But as a committed contrarian on almost everything, I’m beginning to wonder if the whole thing might turn out to be a non-event. There is an expectation in the market right now that the election result will be messy. And because that is a widely held view, there has been an enormous amount of volatility hedging around the event. If everyone is hedged – if everyone knows that everyone knows the election result will produce volatility and they’ve hedged against it – is it possible that it produces none? I honestly don’t have a clue who will win the Presidential election or which party will control Congress or whether either party will control them all. But I can think of plenty of combinations that don’t produce market chaos.
In any case, we don’t make investment decisions based on politics. There are bigger forces at work in the global economy than who occupies the Oval Office. Besides, if there is a group of people who more consistently over-promise and under-deliver than politicians I haven’t met them. They are rarely able to do nearly as much as they threaten to do. So, on election night I suggest you relax with your favorite beverage and settle in for a long night. If you’re lucky you’ll fall asleep.
You Might Also Like
 Uh Oh, The Dollar Has Caught A Bid
Anyone who follows Alhambra knows that we keep an eye on the dollar. It is a very important part of our process of identifying the economic environment. A rising dollar, when combined with a falling rate of growth, can be a lethal combination. That was the situation in March and of course during the financial crisis of 2008.
 Monthly Market Monitor – July 2020
Most Long-Term Trends Have Not Changed. A lot has changed over the last 4 months since the COVID virus started to impact the global economy. Asia was infected first with China at ground zero. Their economy succumbed first with a large part of the country shut down to a degree that can only be accomplished in an authoritarian regime.
 Monthly Macro Monitor – August 2020
One of the advantages we enjoy here at Alhambra is the opportunity to interact with a lot of investors. We talk to hundreds of individual investors on a monthly basis, giving us a front-row seat to everyone’s fear and greed. Economic data tells us about the past, which isn’t particularly useful for investors focused on the future.
 Monthly Macro Monitor – August 2020 (VIDEO)
Monthly macro monitor review of August 2020 with Bob Williams and Joe Calhoun.
 Not This Again: Too Many Treasuries?
Tomorrow, the Treasury Department is going to announce the results of its latest bond auction. A truly massive one, $47 billion are being offered of CAH4’s notes dated August 31, 2020, maturing out in August 31, 2027. In other words, the belly of the belly, the 7s.We’ve already seen them drop for two note auctions this week, both equally sizable.
 Monthly Macro Monitor – June 2020
The stock market has recovered most of its losses from the March COVID-19 induced sell-off and the enthusiasm with which stocks are being bought – and sold but mostly bought – could lead one to believe that the crisis is over, that the economy has completely or nearly completely recovered. Unfortunately, other markets do not support that notion nor does the available economic data.
 Accusing the Accused of Excusing the Mountain of Evidence
Why not let the accused also sit in the jury box? The answer seems rather obvious. While maybe the truly honest man accused of a crime he did commit would vote for his own conviction, the world seems a bit short on supply of those while long and deep offering up practitioners of pure sophistry in their stead.
 Re-recession Not Required
If we are going to see negative nominal Treasury rates, what would guide yields toward such a plunge? It seems like a recession is the ticket, the only way would have to be a major economic downturn. Since we’ve already experienced one in 2020, a big one no less, and are already on our way back up to recovery (some say), then have we seen the lows in rates?Not for nothing, every couple years when we do those (record low yields) that’s what “they” always say and yet they only ever go lower the next time. But what do we mean by “the next time?”Before getting into it, the central bank simply doesn’t factor. Monetary authorities possess no monetary abilities therefore they follow along with what bond markets are already doing. Sometimes that means lowering their benchmarks, like Jay Powell’s
Tags: 10 year treasury note yield,Alhambra Research,Bonds,commodities,copper/gold ratio,currencies,economic growth,economic recovery,economy,election 2020,existing home sales,Featured,federal-reserve,Gold,Housing,Housing Starts,inflation targeting,Interest rates,Markets,New Home Sales,newsletter,real yields,stocks,TIPS,US dollar,Yield Curve