George Dorgan
My articles My siteAbout meMy booksMy videos
Follow on:TwitterFacebookGoogle +
CFA SocietySeeking Alpha
Swiss Franc Currency Index While the dollar index had another bad week with a 0.75% less, the Swiss Franc currency index could accumulate the corresponding gains. Main reason is that the EUR/CHF rose over 1.07. The euro is still the main component of the Swiss Franc index, but the dollar is recovering thanks to rising pharmacy exports to the U.S. Trade-weighted index Swiss Franc, April 22(see more posts on Swiss Franc Index, ) Source: markets.ft.com - Click to enlarge Swiss Franc Currency Index (3 years) The Swiss Franc index is the trade-weighted currency performance (see the currency basket)On a three years interval, the Swiss Franc had a weak performance. The dollar index was far stronger. The dollar makes up 33% of the SNB portfolio and 25% of Swiss exports (incl. countries like China or Arab countries that use the dollar for exchanges). Contrary to popular believe, the CHF index gained only 1.73% in 2015. It lost 9.52% in 2014, when the dollar (and yuan) strongly improved. Swiss Franc Currency Index (3 years), April 22(see more posts on Swiss Franc Index, ) Source: markets.ft.com - Click to enlarge USD/CHF For the first time in April, the USD/CHF dived under parity. The next target is the 0.98 achieved.
Topics:
George Dorgan considers the following as important: Australian Dollar, Bollinger Bands, British Pound, Canadian Dollar, Crude Oil, EUR-USD, EUR/CHF, Euro, Euro Dollar, Featured, FX Trends, Japanese Yen, MACDs Moving Average, Mario Draghi, newslettersent, RSI Relative Strength, S&P 500 Index, S&P 500 Index, Stochastics, Swiss Franc Index, U.S. Dollar Index, U.S. Treasuries, USD/CHF, USDJPY
This could be interesting, too:
Nachrichten Ticker - www.finanzen.ch writes Die Performance der Kryptowährungen in KW 9: Das hat sich bei Bitcoin, Ether & Co. getan
Nachrichten Ticker - www.finanzen.ch writes Wer verbirgt sich hinter der Ethereum-Technologie?
Marc Chandler writes March 2025 Monthly
Mark Thornton writes Is Amazon a Union-Busting Leviathan?
Swiss Franc Currency IndexWhile the dollar index had another bad week with a 0.75% less, the Swiss Franc currency index could accumulate the corresponding gains. Main reason is that the EUR/CHF rose over 1.07. The euro is still the main component of the Swiss Franc index, but the dollar is recovering thanks to rising pharmacy exports to the U.S. |
Trade-weighted index Swiss Franc, April 22(see more posts on Swiss Franc Index, ) Source: markets.ft.com - Click to enlarge |
Swiss Franc Currency Index (3 years)The Swiss Franc index is the trade-weighted currency performance (see the currency basket)On a three years interval, the Swiss Franc had a weak performance. The dollar index was far stronger. The dollar makes up 33% of the SNB portfolio and 25% of Swiss exports (incl. countries like China or Arab countries that use the dollar for exchanges).
|
Swiss Franc Currency Index (3 years), April 22(see more posts on Swiss Franc Index, )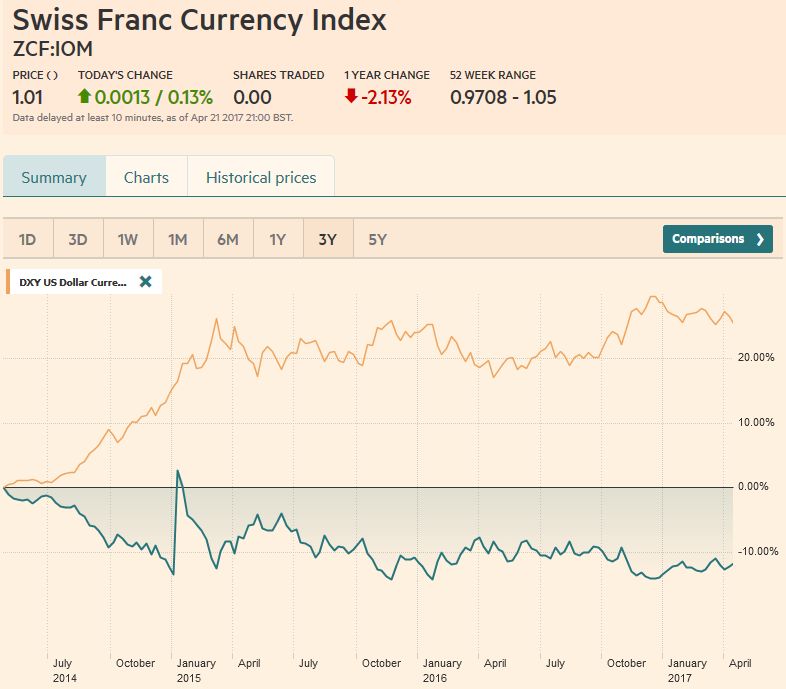 Source: markets.ft.com - Click to enlarge |
| USD/CHF
For the first time in April, the USD/CHF dived under parity. The next target is the 0.98 achieved. |
US Dollar/Swiss Franc FX Spot Rate, April 22(see more posts on USD/CHF, )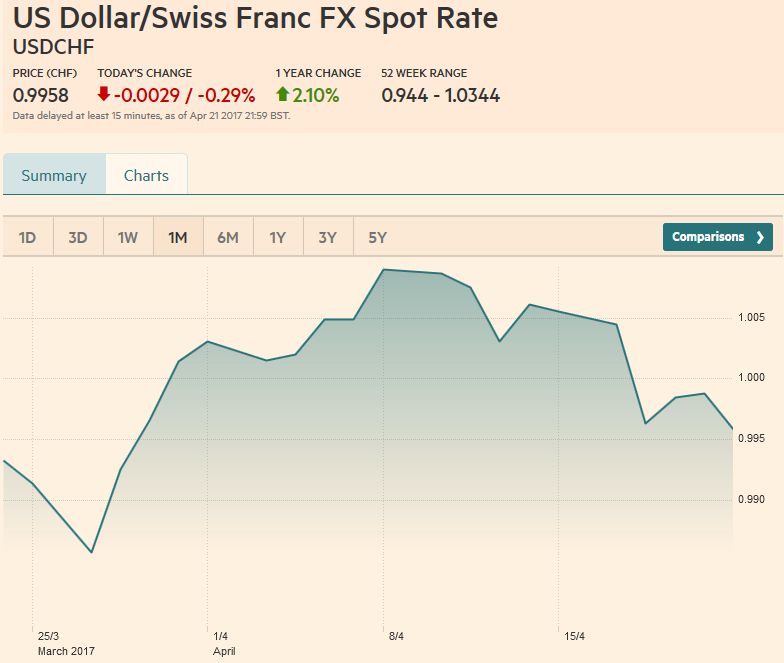 Source: markets.ft.com - Click to enlarge |
US Dollar IndexThe US dollar turned in a mixed performance last week, as yields stabilized. However, the technical condition still has not turned convincingly in the dollar’s favor against most of the major foreign currencies. On the other hand, our fundamental conviction that the divergence theme remains intact and is the underlying driver continues to inform our constructive outlook.
|
US Dollar Currency Index, April 22(see more posts on U.S. Dollar Index, )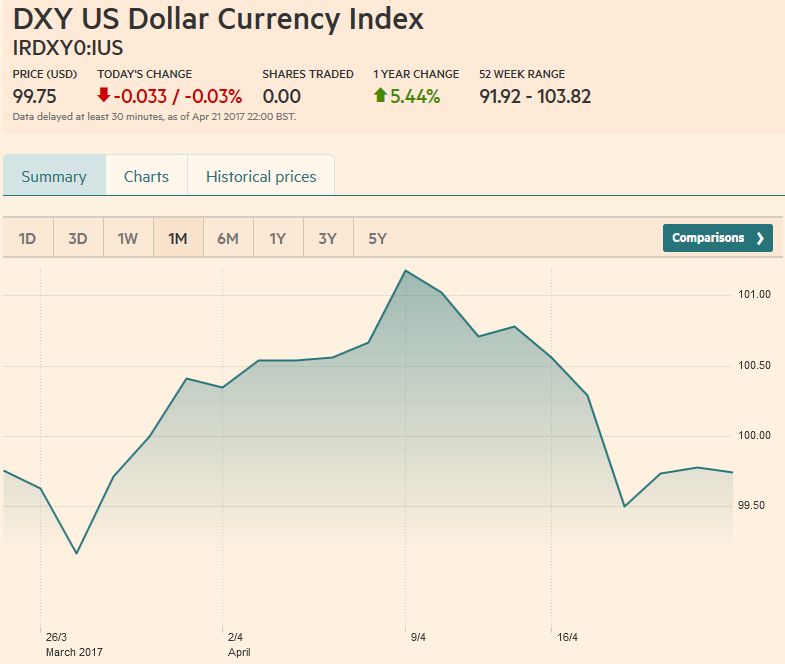 Source: markets.ft.com - Click to enlarge |
EUR/USDOn the eve of the French presidential election, the euro eased to three-day lows. At $1.07, it retraced 38.2% of its gains since the April 10 low of $1.0570. The 50% retracement is near $1.0675, which roughly corresponds with the highs from April 12, 13, and 17th.
The 20-day moving average is near $1.0680 and the 61.8% retracement is by $1.0650. None of the technical indicators point to a high in place, but the rejection of the $1.0780 area on April 20 needs to be overcome to signal another leg higher.
While a market friendly result of the French election may lift the euro in a knee-jerk reaction, we suspect the gains will be limited because this is the result that was anticipated, and ahead of the ECB meeting where Draghi is likely to push against ideas that a tapering or a rate hike is warranted. It may take a break of the $1.0570-$1.0600 to signal that a top is in place.
|
EUR/USD with Technical Indicators, April 22(see more posts on Bollinger Bands, EUR / USD, MACDs Moving Average, RSI Relative Strength, Stochastics, )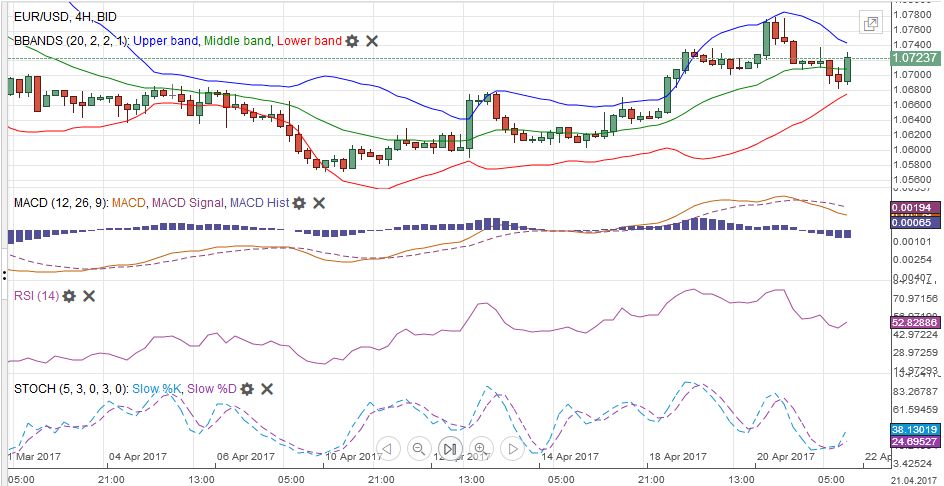 EUR/USD Week Ending April 22 with Technical Indicators - Click to enlarge |
USD/JPYThe dollar snapped a two week slide against the yen.
The April 14 low near JPY108 has not revisited, but the bounce was capped near JPY109.50. The dollar needs to move back above JPY110 to remove the downside pressure. The technical indicators are somewhat more encouraging. The MACDs are trying to turn higher, and the Slow Stochasitics did not confirm move to JPY108 in the spot market and also seem poised to cross higher.
|
USD/JPY with Technical Indicators, April 22(see more posts on Bollinger Bands, MACDs Moving Average, RSI Relative Strength, Stochastics, USD/JPY, )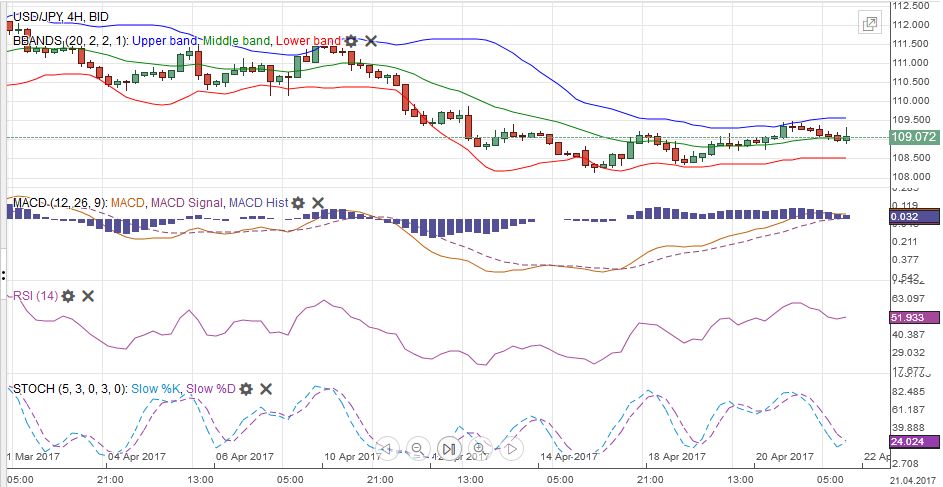 USD/JPY Week Ending April 22 with Technical Indicators - Click to enlarge |
GBP/USDUK Prime Minister May’s call to early elections lit a fire under sterling. Sterling was the star performer, gaining nearly 2.2% against the dollar, the most since early November.
Sterling had wind to its back before May’s surprise. It has advanced in five of the past six week. In the three sessions since the announcement, sterling consolidated in about a cent range ($1.2760-$1.2860). There is little doubt that May will have a stronger majority after the June 8 election. She will likely be in a better negotiating position vis a vis her domestic rivals and EU negotiators. It increases the chances that an agreement will be struck.
We read the technical indicators as suggesting there is scope for addition gains, but suspect the $1.3000-$1.3050 may be difficult to overcome.
The surge in sterling lifted it above the top of the Bollinger Band, but that band is widening, allowing sterling to move back into it. After the disappointing March retail sales, sterling slipped to meet the 38.2% retracement of the election bounce, which corresponds to the five-day moving average.
The 50% retracement is found at $1.2710. Meanwhile, despite some hawkish talk from the BOE’s Saunders, the implied yield of the of the December short sterling futures edged lower for the fourth consecutive week.
|
GBP/USD with Technical Indicators, April 22(see more posts on Bollinger Bands, GBP/USD, MACDs Moving Average, RSI Relative Strength, Stochastics, )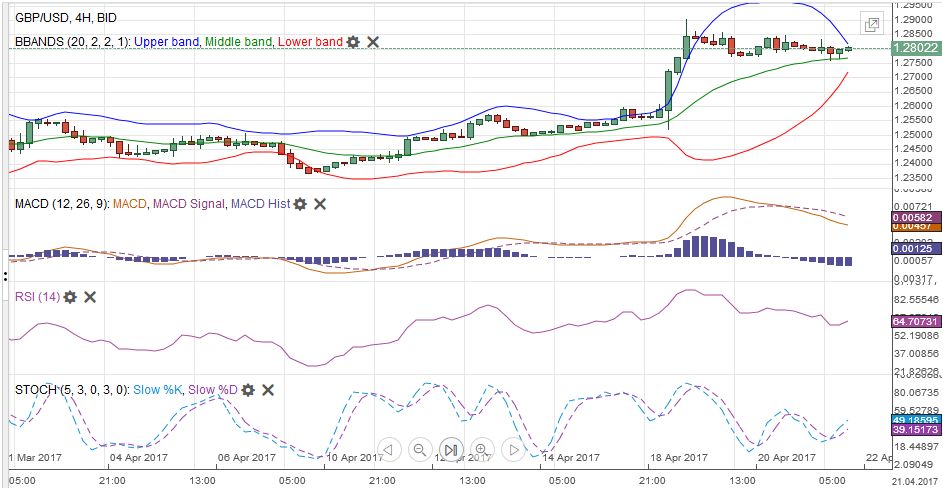 GBP/USD Week Ending April 22 with Technical Indicators - Click to enlarge |
AUD/USDFor the past seven weeks, the Australian dollar has been alternating between advances and declines. The lower end of the $0.7500-$0.7700 range has been frayed, just like the upper end frayed in March and February. The price action argues against playing the breakout and the technical indicators appear to concur. A firm Q1 CPI report next week may help reinforce the lower end of the range.
|
AUD/USD with Technical Indicators, April 22(see more posts on Australian Dollar, Bollinger Bands, MACDs Moving Average, RSI Relative Strength, Stochastics, )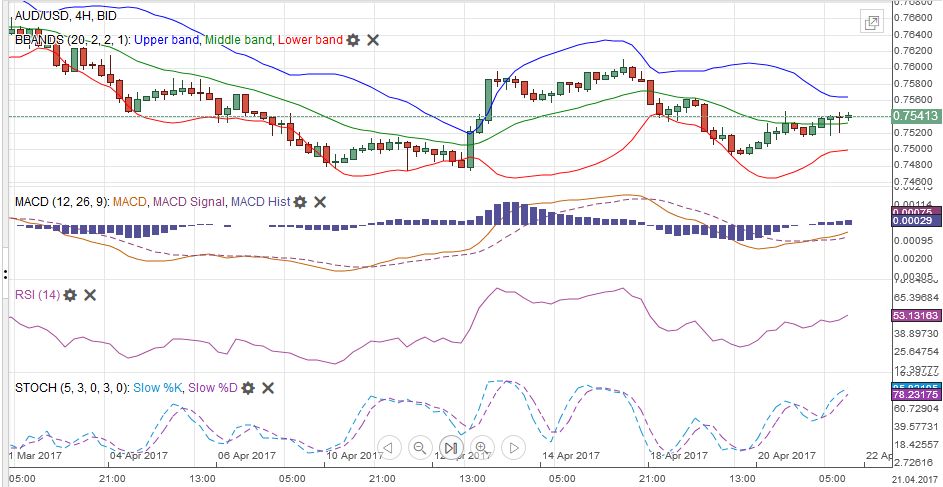 AUD/USD Week Ending April 22 with Technical Indicators - Click to enlarge |
USD/CADThe Canadian dollar was the weakest of the major currencies last week, losing 1.3%, with the US dollar moving above CAD1.35 for only the second time this year.
The technical indicators point to additional US dollar strength, with CAD1.3575-CAD1.36 being the next obvious target. In addition to corresponding to the highs from Q4 16, it is also the 50% retracement objective of the US dollar slide from the January 16 high near CAD1.4700. The greenback’s sharp advance is forcing the Bollinger Band to widen. The upper band is found near CAD1.3500.
|
USD/CAD with Technical Indicators, April 22(see more posts on Bollinger Bands, Canadian Dollar, MACDs Moving Average, RSI Relative Strength, Stochastics, )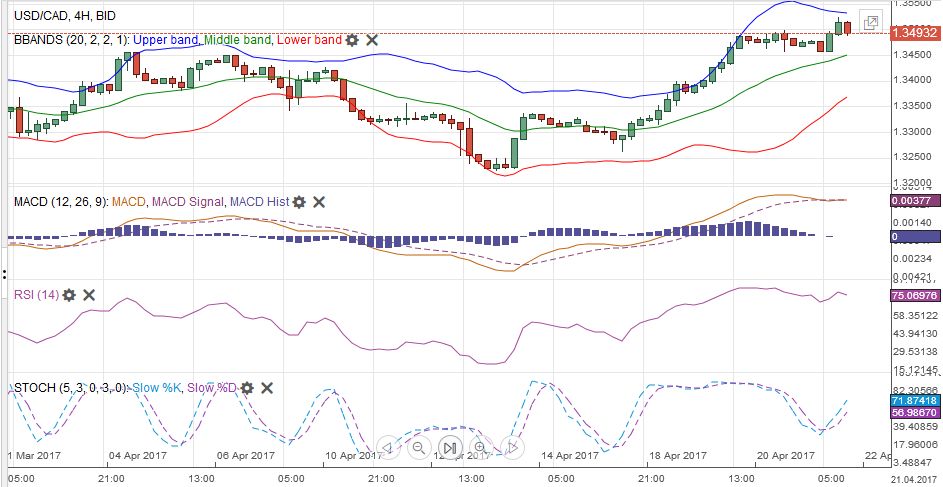 USD/CAD Week Ending April 22 with Technical Indicators - Click to enlarge |
Crude OilThe June crude oil futures dropped fell each day last week for a 7.4% decline.
It appeared trigger stop losses selling as it fell through the 61.8% retracement objective of the rally from the end of March low near $47.65 to April 12 high near $54.15 that was found near the $50 level. Sentiment is poor as OPEC output cuts have not reduced the record inventories, and US simply shifted some of the surplus oil into gasoline. The next target is $48, where the trend line of the low before the output cut agreement and last month’s low can be found. Those March lows are found near $47.50. Technical indicators favor additional declines in the days ahead.
|
Crude Oil, April 2016 - April 2017(see more posts on Crude Oil, )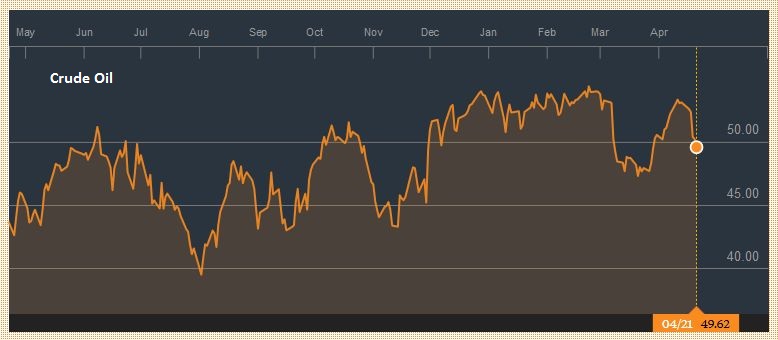 Source: Bloomberg.com - Click to enlarge |
U.S. TreasuriesUS 10-year yields moved back above 2.20%, but until they manage to get back above 2.30%, it is not clear that the low is in place.
Indeed, they have struggled to get above 2.25%. The June note futures contract has built a shelf around 125-24. A break of that is necessary to boost confidence that a top is in place. The technical indicators are stretched but do not confirm a top. A move above 126-20, last week’s high, signals a move toward 127-00 and possibly 127-30, which corresponds to the 50% and 61.8% retracement objectives (on a continuation contract basis) of the sell-off since the US election last November.
|
Yield US Treasuries 10 years, April 2016 - April 2017(see more posts on U.S. Treasuries, )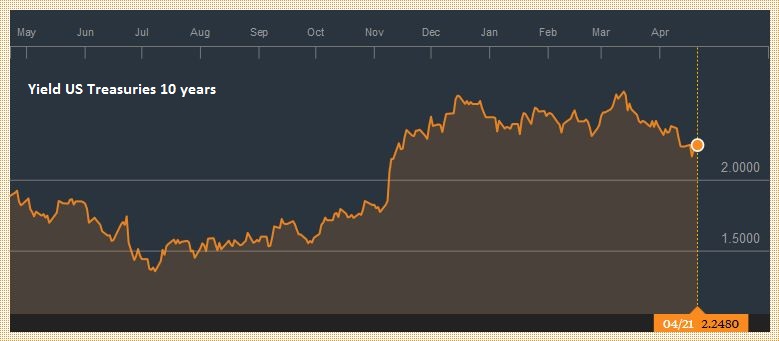 Source: Bloomberg.com - Click to enlarge |
S&P 500 IndexThe S&P 500 rose for the first time in three weeks, and the 0.85 gain was the most since mid-February.
When every thing is said and done, the S&P 500 is still about 2% from its record high seen at the start of last month. The most likely scenario, from a technical perspective, may be continued consolidation (in a potential larger triangle or wedge pattern). The April low is above the March low, while lower highs have been recorded. That down sloping upper trendline is seen in the 2360-2365 area.
|
S&P 500 Index, April 22(see more posts on S&P 500 Index, )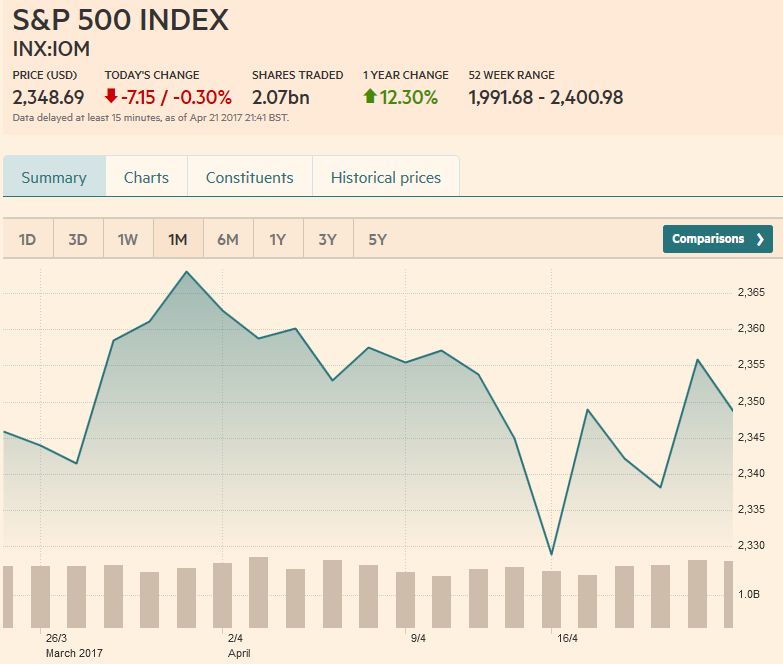 Source: markets.ft.com - Click to enlarge |
Tags: Australian Dollar,Bollinger Bands,British Pound,Canadian Dollar,Crude Oil,EUR / USD,EUR/CHF,Euro,Euro Dollar,Featured,Japanese yen,MACDs Moving Average,Mario Draghi,newslettersent,RSI Relative Strength,S&P 500 Index,Stochastics,Swiss Franc Index,U.S. Dollar Index,U.S. Treasuries,USD/CHF,USD/JPY