At 2099.06 points the S&P 500 is now in a confirmed uptrend and on the cusp of attacking the 19 April high of 2100.80. If it conquers this pressure point, the index will enter a zone of resistance up to 2126.64 points. This range will certainly be treated by the market with due trepidation, when it returns from the Memorial Day holiday on Tuesday! According to my stochastics indicator, the market appears to be over-bought and my Grail momentum indicator is swinging a bit to the down-side. A far more interesting factor is shown in the table, because its value coincides with the area of the resistance zone. The S&P 500’s average earnings growth has been steadily declining since 2010 and has lost -15.42% from its peak in that year. It appears to confirm the growth stagnation of the U.S. economy, and could signal an impending correction or even the start of a recessionary trend if other factors feed into the decline. The projected P/E ratio calculated by Standard & Poors is 18.73, which, if correct, would cause the S&P 500 to drop to 1620.71 points, a loss in the index of 22.82% with a 24.6% probability! S&P 500 average earnings growth rate S&P 500’s current P/E Ratio S&P 500’s Expected Value .53 x 24.26 = 2123.48 This scenario of course all remains to be seen, but it suggests that a black swan baby in the making, because the estimate also confirms the U.S.
Topics:
John Henry Smith considers the following as important: Benjamin Disraeli, Featured, Free Portfolio, Grail Securities, newsletter, U.S. Gross Domestic Product
This could be interesting, too:
Nachrichten Ticker - www.finanzen.ch writes Die Performance der Kryptowährungen in KW 9: Das hat sich bei Bitcoin, Ether & Co. getan
Nachrichten Ticker - www.finanzen.ch writes Wer verbirgt sich hinter der Ethereum-Technologie?
Martin Hartmann writes Eine Analyse nach den Lehren von Milton Friedman
Marc Chandler writes March 2025 Monthly
At 2099.06 points the S&P 500 is now in a confirmed uptrend and on the cusp of attacking the 19 April high of 2100.80. If it conquers this pressure point, the index will enter a zone of resistance up to 2126.64 points. This range will certainly be treated by the market with due trepidation, when it returns from the Memorial Day holiday on Tuesday!
 According to my stochastics indicator, the market appears to be over-bought and my Grail momentum indicator is swinging a bit to the down-side. A far more interesting factor is shown in the table, because its value coincides with the area of the resistance zone. The S&P 500’s average earnings growth has been steadily declining since 2010 and has lost -15.42% from its peak in that year. It appears to confirm the growth stagnation of the U.S. economy, and could signal an impending correction or even the start of a recessionary trend if other factors feed into the decline. The projected P/E ratio calculated by Standard & Poors is 18.73, which, if correct, would cause the S&P 500 to drop to 1620.71 points, a loss in the index of 22.82% with a 24.6% probability!
| S&P 500 average earnings growth rate | S&P 500’s current P/E Ratio | S&P 500’s Expected Value | ||
| $87.53 | x | 24.26 | = | 2123.48 |
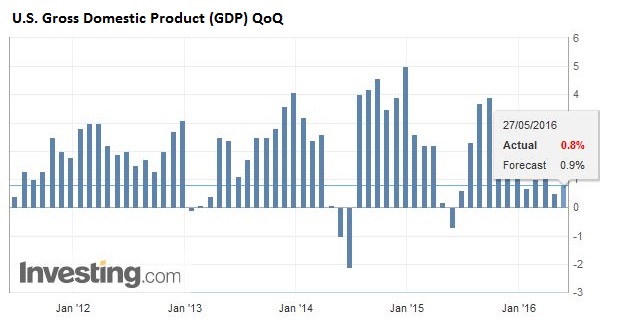
This scenario of course all remains to be seen, but it suggests that a black swan baby in the making, because the estimate also confirms the U.S.’s GDP 1st quarter figure, which has been revised upwards recently from 0.5% to 0.8%, but is still altogether very meagre and fragile. An annual GDP growth of 2% plus now seems rather remote for 2016. |
|
What tends to exacerbate matters is the uncertainty of the “we will – we won’t” vacillation of the Federal Reserve, which is tending to oscillate into a more middle stance, as evidenced after its latest meeting announcement of ‘a rate hike in the coming months!’, which injected a bit of life into this docile market last Thursday.
It all looks like everything fits together, but I’m reminded of what Benjamin Disraeli, the British Prime Minister in the 19th century, is said to have proclaimed, ”There are lies, bloody lies, and then there are statistics.” So the fit I suggest may just simply be a potential outlier. Be that as it may, it is nevertheless prudent to be prepared for any outcome.
|
This free portfolio is offered to give investors direct exposure to market leading alpha stocks of the highest calibre, which is the hallmark of the GEMS method of investing. |
 |
 |


