The S&P 500 now stands at 1880.33 points, only 31.97 points from its 2015 opening price of 1848.36; for the broad market, a year’s meager gains almost wiped clean. The index’s P/E ratio now stands at 19.81, and is still well above its historic average of 15.57. S&P 500 Year To Date Performance The market confirmed my fears of last week that it was in free-fall. In fact, it posted its worst ever 10-day losses for a year-begin! The week saw only Utilities post a modest gain of 0.24%, and for the year so far none of the 31 industries are in positive territory; the best, being again Utilities with a loss of 0.83%, and the worst still Gold and Mining, being down 15.03%! Only 11.8% of the 6,181 stocks monitored by the Grail Equity Management System (GEMS) are in plus, and just 40 stocks in the S&P 500 could book gains of between 11.36% to 0.02%. The following index table shows the extent that uncertainty and fear are stalking the market: Index (Jan 22, 2016) Year-to-datePerformance From their2015 Peak S&P 500 -8.0% -11.8% DJ-30 -8.2% -12.7% Russell-1000 Large Cap -8.3% -12.7% S&P-Mid cap 400 -10.0% -17.6% Nasdaq -10.4% -14.0% Russell-2000 Small Cap -11.3% -22.0% US Equity Market held hostage by the Oil Bust The above year-to-date declines and those from mid-2015 suggest that the market appears to be rapidly moving towards a bear market. For most of 2015, the U.S.
Topics:
John Henry Smith considers the following as important: Featured, Grail Securities, newsletter
This could be interesting, too:
Nachrichten Ticker - www.finanzen.ch writes Die Performance der Kryptowährungen in KW 9: Das hat sich bei Bitcoin, Ether & Co. getan
Nachrichten Ticker - www.finanzen.ch writes Wer verbirgt sich hinter der Ethereum-Technologie?
Martin Hartmann writes Eine Analyse nach den Lehren von Milton Friedman
Marc Chandler writes March 2025 Monthly
The S&P 500 now stands at 1880.33 points, only 31.97 points from its 2015 opening price of 1848.36; for the broad market, a year’s meager gains almost wiped clean. The index’s P/E ratio now stands at 19.81, and is still well above its historic average of 15.57.
S&P 500 Year To Date Performance
The market confirmed my fears of last week that it was in free-fall. In fact, it posted its worst ever 10-day losses for a year-begin! The week saw only Utilities post a modest gain of 0.24%, and for the year so far none of the 31 industries are in positive territory; the best, being again Utilities with a loss of 0.83%, and the worst still Gold and Mining, being down 15.03%! Only 11.8% of the 6,181 stocks monitored by the Grail Equity Management System (GEMS) are in plus, and just 40 stocks in the S&P 500 could book gains of between 11.36% to 0.02%. The following index table shows the extent that uncertainty and fear are stalking the market:
| Index (Jan 22, 2016) | Year-to-date Performance |
From their 2015 Peak |
| S&P 500 | -8.0% | -11.8% |
| DJ-30 | -8.2% | -12.7% |
| Russell-1000 Large Cap | -8.3% | -12.7% |
| S&P-Mid cap 400 | -10.0% | -17.6% |
| Nasdaq | -10.4% | -14.0% |
| Russell-2000 Small Cap | -11.3% | -22.0% |
 US Equity Market held hostage by the Oil Bust
The above year-to-date declines and those from mid-2015 suggest that the market appears to be rapidly moving towards a bear market.
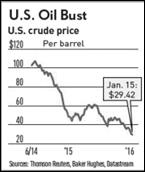
For most of 2015, the U.S. equity market was held hostage to the threat of a 0.25% interest rate rise. Now this chameleon market has caste an eye on the continued fall in oil prices, which slid another 4.8% on Friday to finish the week under the key price of $30 per barrel. Its other eye focused on the severe falls of the heavily retail-overleveraged Chinese stock market.
This week’s down-drought was fanned by an alarming increase in Chinese bad loans as well as the fallout from the Government’s program of moving away from an export-dominated to a consumption-led economy and taken together explains why the market has turned a deeper red.  Market sentiment is having trouble fitting these changes and other manifest factors into a bullish scenario. The broad profit recession will in all probability continue to dampen corporate growth prospects this year, the restrainer being the dollar’s strength diluting the repatriated profits of U.S. Multinationals and its rate of exchange impact on dollar-denominated products for other countries. Thus any further interest rate hikes could create further trade imbalances between the U.S. and dollar-dependent national economies, which could develop into self-fulfilling prophecies of recession for the U.S. and its partners. For example, in December, the U.S. consumer price index fell by 1%, the most in seven years, and another report shows that U.S. economy is expected to grow only 0.6 percent in the the last quarter, because of disappointing retail sales and industrial output.
Stocks are Oversold
Stocks are clearly oversold, and a relief rally seems in the cards. But for a resumption of the bull market we need to see oil prices rising and China’s economy looking stronger. We would also need to see earnings season turn out well, but by the looks of energy and bank earnings this week, it is likely that the first quarter will disappoint. Of course reporting earnings is mostly a look in the rear mirror, but the guidance give will be pounded into stock prices in the hardest of terms and will set the intermediate trends, either up, sideways or down, of share prices. As GEMS engages in fundamental and technical analysis, it is eminently equipped to meet all the challenges of a volatile year, if only because of the assumption that earnings drive stock prices!

