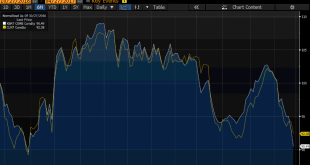
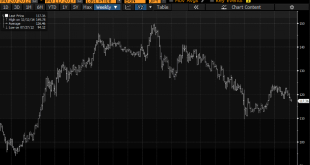
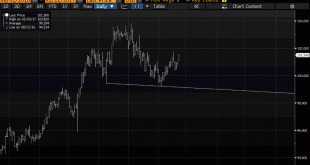
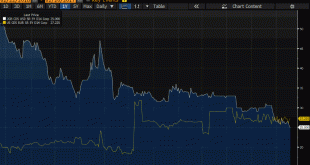
Summary: Steep falls in gasoline and oil prices. Large build in gasoline inventories and record refinery work shifted some surplus from oil to the products. OPEC is expected to roll over its output cuts, but non-OPEC may find it difficult and US output continues to rise. This Great Graphic, made on Bloomberg, shows the past six months of oil and gas prices. The white line is the June gasoline futures and the...
Read More »NAFTA Trade Update
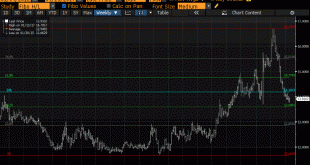
Summary: The trade tensions between the US and Canada set the Canadian dollar to lows for the year. The dollar’s downside momentum against the Mexican peso has eased. The Canadian dollar looks attractive not against the US dollar but against the peso. The Trump Administration has switched gears. During the campaign through the inauguration, Trump picked on Mexico. The rhetoric and threats drove the peso to...
Read More »Longevity and Income
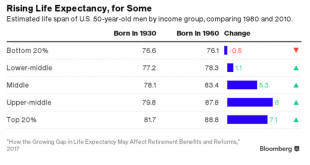
Summary: Rich people live longer than poor people in the US. This disparity undermines the progressive nature of Social Security. Disparity of income seems more important than the slowdown in growth in explaining why few US people are doing better than their parents at the age of 30. Americans do not like to talk about class. Many like to think that there are no classes in the US and that sufficient hard work...
Read More »State of Dollar Bull Market
Summary: The dollar market is intact, despite the pullback here at the start of 2017. We have seen similar pullbacks in 2016 and 2015. Divergence remains the key driver. The Federal Reserve’s real broad trade-weighted dollar fell for the first three months of 2017, and the greenback’s heavy tone this month has raised questions about the state of the bull market. Despite this recent weakness, we think the...
Read More »Euro’s Record Losing Streak Against the Yen
Summary: The euro has fallen for 11 consecutive sessions against the yen. Interest rates, US and German in particular, seem to be the main driver. Technicals are stretched, but have not signaled a reversal yet. Looking for a trend in the foreign exchange market? The euro is weaker against the yen for the 11th consecutive session today, which is the longest streak in the euro’s natural life. Since March 17, the...
Read More »Great Graphic: Emerging Market Stocks
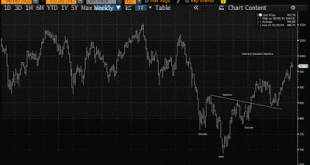
Summary: MSCI Emerging Market Index is up 12.25% here in Q1. The index is approaching long-standing technical objectives. Look for profit-taking ahead of quarter-end as fund managers rebalance. This Great Graphic from Bloomberg is a weekly bar chart of MSCI Emerging Market equity index. In H2 15 and H1 16, it carved out a head and shoulders bottom that we identify on the chart. We also drew in the neckline...
Read More »Great Graphic: Fed’s Real Broad Trade Weighted Dollar
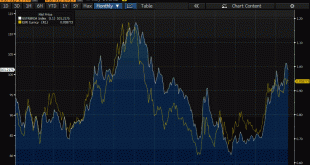
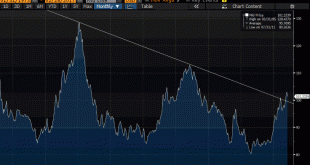
To begin assessing the dollar’s impact on the US economy, nominal bilateral exchange rates may be misleading. From a policymakers’ point of view, the real broad trade weighted measure is more important. The Federal Reserve tracks it on a monthly basis. This measure of the dollar snapped a four-month advancing streak ended in January with a marginal loss (0.05%). Last month, the real broad trade weighted measure fell...
Read More »Primary Budget Balances in EMU
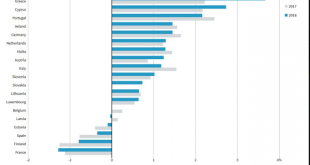
Summary: Greece debt has rallied as a repeat of the 2015 crisis seems less likely. The EC may turn its attention to Italy’s structural deficit. There are several countries, including France that is forecast to have a larger primary deficit in 2018 than 2017. With the official creditors on their way back shortly to Athens, there is a sense that a repeat of 2015 crisis can be avoided. There is a collective sigh...
Read More »Dollar Index: The Chart Everyone is Talking About
Summary: Many are discussing a possible head-and-shoulders pattern in the Dollar Index. We are skeptical as other technical signals do not confirm. We recognize scope for disappointment over the border tax and the next batch of employment data, but European politics is the present driver and may not be alleviated soon. Here is the chart nearly everyone is discussing. The Dollar Index appears to be carving...
Read More »Great Graphic: US and Japan Five-Year Credit Default Swaps
Summary: For the first time since the financial crisis, the 5-year CDS on JGBs is dipping below the 5-year US CDS. It appears to be more a function of a decline in Japan’s CDS than a rise in the US CDS. We are reluctant to read too much into the small price changes in the mostly illiquid instruments. This Great Graphic was created on Bloomberg and depicts Japan and US 5-year credit default swap indicative...
Read More » Swiss Economicblogs.org

