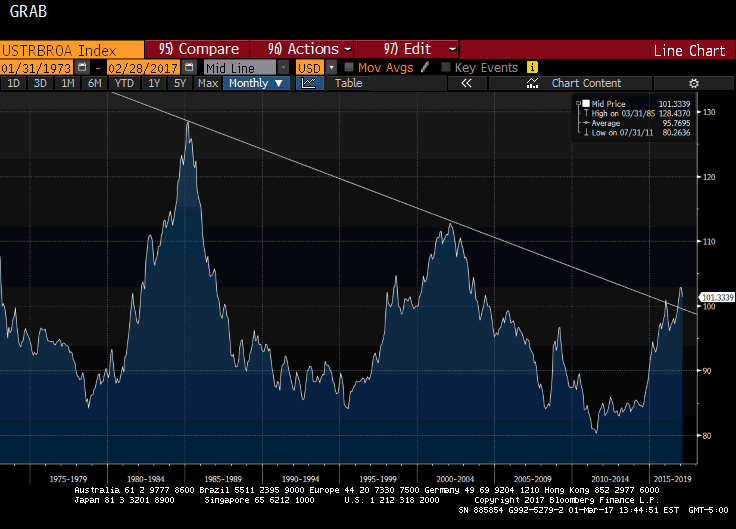
To begin assessing the dollar’s impact on the US economy, nominal bilateral exchange rates may be misleading. From a policymakers’ point of view, the real broad trade weighted measure is more important. The Federal Reserve tracks it on a monthly basis. This measure of the dollar snapped a four-month advancing streak ended in January with a marginal loss (0.05%). Last month, the real broad trade weighted measure fell 1.41%, the largest fall since last March’s 2.09% decline. Recall that last year this measure of the dollar fell in only one month (August -0.81%) after April. In the first four months of 2016, it fell in the three months after January’s 2.35% advance. In 2015, it fell in three months (April, May and October). The Great Graphic, created on Bloomberg, shows Fed’s real broad trade weighted dollar going back to the 1970s. A trendline is drawn off the peaks of the Reagan and Clinton dollar rallies. It has been violated, and is above 2% above the trendline. The Fed seems to be more concerned about the pace of change than the particular level of the dollar. Over the last three months, the real broad trade weighted dollar is essentially flat. Officials cannot be disappointed. It has not declined in both January and February for five years.
Topics:
Marc Chandler considers the following as important: Featured, FX Trends, Great Graphic, newslettersent, USD
This could be interesting, too:
Nachrichten Ticker - www.finanzen.ch writes Die Performance der Kryptowährungen in KW 9: Das hat sich bei Bitcoin, Ether & Co. getan
Nachrichten Ticker - www.finanzen.ch writes Wer verbirgt sich hinter der Ethereum-Technologie?
Marc Chandler writes March 2025 Monthly
Mark Thornton writes Is Amazon a Union-Busting Leviathan?
|
To begin assessing the dollar’s impact on the US economy, nominal bilateral exchange rates may be misleading. From a policymakers’ point of view, the real broad trade weighted measure is more important. The Federal Reserve tracks it on a monthly basis.
This measure of the dollar snapped a four-month advancing streak ended in January with a marginal loss (0.05%). Last month, the real broad trade weighted measure fell 1.41%, the largest fall since last March’s 2.09% decline. Recall that last year this measure of the dollar fell in only one month (August -0.81%) after April. In the first four months of 2016, it fell in the three months after January’s 2.35% advance. In 2015, it fell in three months (April, May and October). The Great Graphic, created on Bloomberg, shows Fed’s real broad trade weighted dollar going back to the 1970s. A trendline is drawn off the peaks of the Reagan and Clinton dollar rallies. It has been violated, and is above 2% above the trendline. The Fed seems to be more concerned about the pace of change than the particular level of the dollar. Over the last three months, the real broad trade weighted dollar is essentially flat. Officials cannot be disappointed. It has not declined in both January and February for five years. In the numerous Fed comments, the dollar has not been featured. It is a non-issue at the moment. The Clinton dollar rally peaked with the real broad trade weighted index near 112.80. It finished last month a little above 101.30. Before the Obama-Trump rally is over, we expect that high to be re-visited. The record low was in July 2011 near 80.25. |
U.S. Real broad trade weighted index |
Tags: #USD,Featured,Great Graphic,newslettersent

