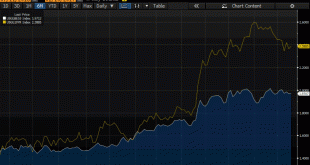
Summary: The Dollar Index is powering ahead, moving higher for the eighth consecutive session. Over the past 100 sessions, gold and the Dollar Index move in the opposite direction more than 90% of the time. The technical condition of gold is deteriorating. The Dollar Index is extending its advancing streak today into its eighth consecutive session. It is at its best level since just before Trump’s...
Read More »Great Graphic: Interesting Sterling Price Action
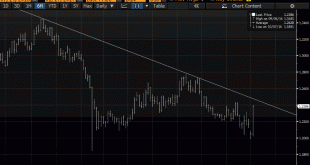
Sterling is having an interesting day. It fell in the face of the US dollar’s bounce but has recovered fully. It has not yet traded above yesterday’s high (~$1.2510) but it may. It does appear to be tracing out a hammer in Japanese candle stick terms. Demand emerged (support) near the 50% retracement objective of advance off the January 16 dip below $1.20. That retracement was $1.2346 and today’s low was one hundredth...
Read More »The Dollar: Real or Nominal Rates?
Real interest rates are nominal rates adjusted for inflation expectations. Inflation expectations are tricky to measure. The Federal Reserve identifies two broad metrics. There are surveys, like the University of Michigan’s consumer confidence survey, and the Fed conducts a regular survey of professional forecasters. There are also market-based measures, like the breakevens, which compare the conventional yield to the...
Read More »Great Graphic: French Premium over Germany Continues to Grow
Summary: European premiums over Germany typically increase in a rising interest rate environment. France’s premium is at the most in two years. France is still set to turn back the challenge from Le Pen. The rise of interest rates in Europe have seen premiums over Germany increase. This is not unusual. Often the intra-European spreads are sensitive to the underlying direction of rates. The premiums often...
Read More »Great Graphic: Mexico and China Unit Labor Costs
Summary: Mexico has been gaining competitiveness over China before last year’s depreciation of the peso. The depreciation of the peso, and other US actions can contribute to the destabilization of Mexico. An economically prosperous and stable Mexico has long been understood to be in the US interest. This Great Graphic was posted by David Merkel on his AlephBlog with a hat tip to Sober Look. It looks at the...
Read More »Great Graphic: How a Strong Dollar Weighs on Net Exports
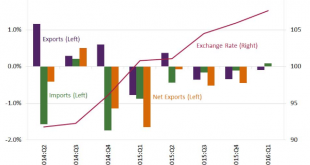
Investors appreciate that a strong dollar can impact US growth through the net export component of GDP. The dollar’s appreciation can push up the price of exports and lower the cost of imports. The St. Louis Fed took a look at how the strong dollar from 2014 to the beginning of 2016 impacted the net export function of GDP. It is clear that a strong dollar in this period was associated with a drag on growth from net...
Read More »Great Graphic: Trade and Tariffs-End of an Era?
This Great Graphic was tweeted by the Financial Time’s John Authers, who got it from @fathomcomment. The green line is the inversion of global trade (right-hand scale). The blue line is a trade-weighted average global tariff rate. What the chart shows is that since 1990, the decline in the average tariff coincided with an increase in trade (remember green line is inverted). However, the as chart illustrates, around the...
Read More »Great Graphic: Is the Pound Sterling?
Sterling’s 2.75% rally today is the biggest advance in more than eight years. The UK government has done a good job of managing expectations. Over the last week or so, Prime Minister May and Chancellor of the Exchequer Hammond has made it clear that the intention was a “clean break” from the EU. There is an implicit threat by both officials not to see a punitive agreement. There was, though little new in May’s speech...
Read More »The Difference of an A and BBB for Italy
Summary: DBRS cut Italy’s rating to BBB from A. It will increase the haircut on Italy’s sovereign bonds used for collateral by Italian banks. It is not a mortal blow or a significant hit, but is not helpful, except to add pressure on Italy and further reduce its ability to respond to another shock. The ECB takes the best credit rating of four agencies to set the haircut on collateral provided by banks for loans....
Read More »Great Graphic: Real Rates in US are Elevated
The US 10-year yield fell briefly below 1.32% last July. The yield slowly rose to reach 1.80% in mid-October. The day after the election, the yield initially slipped to almost 1.71%. This was a bit of a miscue, and the yield rose sharply to hit almost 2.64% the day after the FOMC hiked rates for the second time in the cycle on December 14. The yield backed off to hit 2.33% at the end of last week. The difference between...
Read More » Swiss Economicblogs.org

