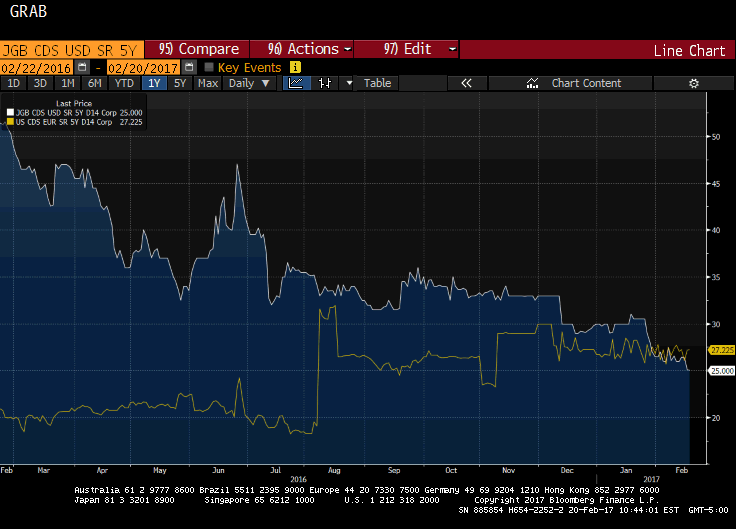
Summary: For the first time since the financial crisis, the 5-year CDS on JGBs is dipping below the 5-year US CDS. It appears to be more a function of a decline in Japan’s CDS than a rise in the US CDS. We are reluctant to read too much into the small price changes in the mostly illiquid instruments. This Great Graphic was created on Bloomberg and depicts Japan and US 5-year credit default swap indicative pricing. Japan’s 5-year CDS is denominated in dollars and is represented by the white line. The US CDS is the white line and is priced in euros. As can be seen by looking closely at the recent performance, the US CDS has risen through Japan’s. This doesnot appear to have happened since throes of the Great Financial Crisis. Some observers want to blame the unorthodox policies of the Trump Administration, but this does not seem right. For the first eight months of last year, the 5-year US CDS traded between 18 bp and about 24 bp. It appears to have jumped to a new and higher range in early August when it rose to almost 32 bp. Since then, it has been mostly in a 25-30 bp range. It finished last week near 27.2 bp, which is smack on the 50- and 100-day moving averages.
Topics:
Marc Chandler considers the following as important: Credit Default Swaps, Featured, FX Trends, Great Graphic, Japan, newslettersent, US
This could be interesting, too:
Nachrichten Ticker - www.finanzen.ch writes Die Performance der Kryptowährungen in KW 9: Das hat sich bei Bitcoin, Ether & Co. getan
Nachrichten Ticker - www.finanzen.ch writes Wer verbirgt sich hinter der Ethereum-Technologie?
Marc Chandler writes March 2025 Monthly
Mark Thornton writes Is Amazon a Union-Busting Leviathan?
Summary:
For the first time since the financial crisis, the 5-year CDS on JGBs is dipping below the 5-year US CDS.
It appears to be more a function of a decline in Japan’s CDS than a rise in the US CDS.
We are reluctant to read too much into the small price changes in the mostly illiquid instruments.
|
This Great Graphic was created on Bloomberg and depicts Japan and US 5-year credit default swap indicative pricing. Japan’s 5-year CDS is denominated in dollars and is represented by the white line. The US CDS is the white line and is priced in euros. As can be seen by looking closely at the recent performance, the US CDS has risen through Japan’s. This doesnot appear to have happened since throes of the Great Financial Crisis. Some observers want to blame the unorthodox policies of the Trump Administration, but this does not seem right. For the first eight months of last year, the 5-year US CDS traded between 18 bp and about 24 bp. It appears to have jumped to a new and higher range in early August when it rose to almost 32 bp. Since then, it has been mostly in a 25-30 bp range. It finished last week near 27.2 bp, which is smack on the 50- and 100-day moving averages. There was a spike to 30 bp following the unexpected results of the US election last November, but it has been trading steadily mostly in a two basis point range for last two months, despite the press conferences, executive orders, and tweets. The US is one of ten countries where the five-year CDS is quoted below 30 bp. It is difficult to call it rich. Norway looks the lowest near 20 bp. Keep in mind too that these are indicative prices and the liquidity appears uneven at best. Japan’s 5-year CDS rose from less than 20 bp in early 2008 to around 155 bp in late 2011 and early 2012. It has been trending lower since, and the low reached at the end of last week (~25 bp) is the lowest since 2008. Some have suggested that the explanation lies with the Japanese investors. They were net sellers of foreign bonds in December and January. It is the first two-month divestment since March-April 2014.
|
Japan and US 5-year credit default swap (CDS) |
Tags: Credit Default Swaps,Featured,Great Graphic,Japan,newslettersent,US

