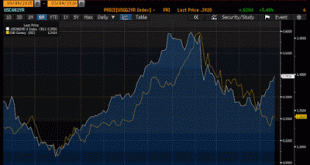
The Canadian dollar appears vulnerable. It remains firm while the US two-year premium over Canada has risen sharply. Like others, we do not expect the Bank of Canada to cut rates today and are looking past it. This Great Graphic was composed on Bloomberg. It shows the 2-year spread (white line) and the US dollar against the Canadian dollar (yellow line). We use two different scales, but the point is not so much how precise they have tracked each other. With two different scales...
Read More »Great Graphic: US 2-year Premium over Germany and Japan at New Cyclical Highs
We argue that the dollar is in its third significant rally since the end of Bretton Woods in 1971. The Reagan dollar rally was driven by the policy mix of tight monetary policy and loose fiscal policy. The G7 effort to stop the dollar's appreciation at the Plaza Hotel in September 1985 marked the end of the Reagan dollar rally. After a nearly ten-year bear market for the dollar, that included the collapse of the Soviet Union, the fall of the Berlin Wall and the ERM crisis, there was a...
Read More »Speculators Add to Short Euro and Sterling Positions
Speculators in the currency futures made mostly small adjustments to their gross foreign currency exposure. There were only three position adjustments of more than 5k contacts. Since the markets turned on 11 February, the Canadian dollar has been the strongest of the major currencies, appreciating a little more than 4.5% against the US dollar. Gross shorts have been nearly halved since then. They were cut by 6.9k contracts or about 10% to reach 61.5k contracts during the recent...
Read More »Great Graphic: Inflation Expectations via 10-Year Breakevens
Over the next fortnight the major central banks, including the ECB, BOJ, Fed and BOE will hold policy-making meetings. Of the four, expectations are the highest for the ECB to ease policy. Given the poor economic data, including deflationary pressures, and the tightening of financial conditions, the BOJ could also adjust policy. However, after the G20 meeting, it seems as if the bar for fresh monetary easing is higher than it had previously appeared. This does not mean that the BOJ...
Read More »Great Graphic: Surplus Capacity is not the Same as Insufficient Aggregate Demand
Many economists argue that the key challenge is that of insufficient aggregate demand. That is why world growth is slow. Hobbled with debt, households have pulled back. Business investment is weak. Government dissavings has been offset by household and business savings. The solution offered by some economists is a large public investment program. The G20 encouraged members not to rely on monetary policy, which even some central bankers are concerned, has reached a point of...
Read More »Great Graphic: Gold Triangle–Continuation or Reversal Pattern?
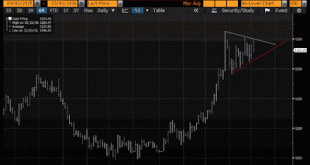
During a period in which the zero bound no longer is the floor of interest rates, and many central banks continue to ease policy, we have been watching gold a bit closer. In early January, we noted that the technical pattern warned of breakout. Our first objective was $1110-$1135. In early February, we updated our view with gold trading near $1150. The charts still looked constructive; we suggested a new target near $1200. The increasingly precious metal rose to almost $1263.5o on...
Read More »Great Graphic: Trade-Weighted Look at Major Currencies
When considering the impact of changing currency prices on an economy, trade-weighted measures are appropriate. The Federal Reserve has cited the dollar's appreciation as a headwind on the economy and a depressant on prices. Given the moves in the spot market, and proximity of the G20 meeting, it may be useful to review what has happen to the trade weighted measures of the major currencies. The data is from the Bank of England. It calculates the trade-weighted indices are a broad range...
Read More »Great Graphic: Dollar May Be Less Important for Fed
Investors and policymakers continue to wrestle with the economic impact of the dollar's rise. The Federal Reserve has argued that the dollar's appreciation acts as a headwind on exports and dampens imported inflation. At the same time, despite the dollar's appreciation and the fall in oil prices, core inflation rose steadily last year. Core CPI rose from 1.6% at the end of 2014 to 2.1% at the end of 2015. The core PCE deflator lagged, but the after bottoming last July below 1.26%, it...
Read More » Swiss Economicblogs.org


