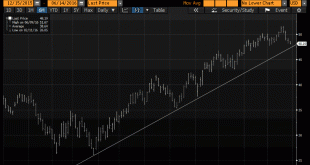
Oil prices reached their highest level in eleven months in the middle of last week. The front-month futures contract did not post a key reversal on June 9, but the continuation contract did. Since reaching almost $51.70 then, prices have pushed lower, with lower highs and lower lows. As this Great Graphic created on Bloomberg shows, a trendline drawn off the mid-February cyclical low, and hitting the early and...
Read More »Democratic Deficit: Is the UK Referendum the Tip of the Iceberg?
One of the most profound criticisms of the EU that it remains, even at this late date, primarily an elite project. The democratic deficit has grown, according to the latest Pew Research multi-country poll. The Pew Research survey covered ten countries that represent 80% of the EU28 population and 82% of the region’s GDP. The poll surveyed nearly 10.5k people between April 4 and May 12. It found that 2/3 of the both...
Read More »Great Graphic: Despite Higher Oil Prices, Middle East Pegs Remain Under Pressure
With today’s gains, the price of Brent has nearly doubled from its lows in January. Of course, the price of oil is still less than half of levels that prevailed two years ago. At the same time, many leveraged investors cast a jaundiced eye toward currency pegs. Many have concluded that the Middle East currency pegs cannot be sustained. Through a combination of the moral suasion and the power of sovereign, Saudi...
Read More »Great Graphic: Brexit Risks Rise
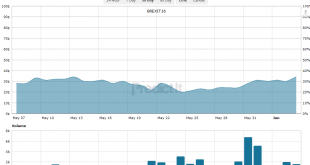
Brexit Predict This Great Graphic shows the price people are willing to pay to bet that the UK votes to leave the EU at the June 23 referendum on the PredictIt events markets. We included the lower chart to give some sense of volume of activity on this wager in this event market. Brexit predict – click to enlarge. Presently, one would have to wager 42 cents to win a dollar if the UK votes to leave. On May 23,...
Read More »Great Graphic: Gold and the Dollar
Many investors still think about gold as if it were money. Economists identify three functions of money: store of value, means of exchange, and a unit of account. It can be a store of value, but the price fluctuates compared with other forms of money, or other commodities, like oil or silver. Some argue that it is a store of value because of the limited supply, but that argument applies to many other goods, including commodities and real estate (which Mark Twain said you have to...
Read More »Great Graphic: Dollar Pushes Back Below JPY110
The yen is the strongest of the major currencies. It has gained about 0.65% against the dollar. It has been grinding lower throughout the Asian and European session and has remained in narrow ranges near its highs in the US morning. Japan still seems isolated in terms of it desire to intervene. Ahead of the G7 heads of state summit this coming, the risk of intervention remains slight. Asian and European shares were lower, which favors the yen. US yields are flat, while the US...
Read More »Great Graphic: Non-Consensus Thinking on Trade
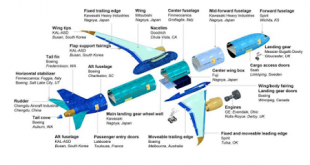
This Great Graphic was posted by Eric Nelson, the managing editor of the Chamber of Commerce’s Above the Fold publication. It shows many of the different components of the 737 single-aisle airplane and where they are sourced. There is a complex supply chain that stretches from Australia, through Asia (e.g., Japan, South Korea, and China) through Europe (France, Sweden, the UK, and Italy). It extends into Canada and several US states as well. Some of the foreign-sourced...
Read More »Great Graphic: Odds of President Trump Rise (Predictit)
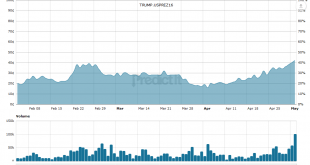
TRUMP . USPREZ16 This Great Graphic is a 90-day history of the “betting” at PredictIt that Trump becomes the new US President. With Cruz suspending his campaign, the odds of Trump have risen just above 40%. TRUMP.USPREZ16 The US national interests and challenges to those interests do not change much from year-to-year, and this may help explain the continuity in US foreign policy (including foreign economic policy). Trump’s campaign style emphasized a break from the conventional...
Read More »Great Graphic:US Rents and Core Inflation
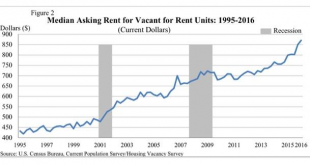
This post is extremely important for understanding the differences between CPI inflation in Europe and in the U.S. “Shelter” makes up 32.8% of the U.S. CPI basket, or 42% of the core inflation rate. It is mostly driven by “Owner’s equivalent rent of primary residence”. Shelter inflation in the U.S. is 3.2% per year (March 2016), but shelter inflation is only 1% in Europe. CPI in the United States (source) in % Shelter 32.776 Rent of primary residence 5.930 Lodging away from home...
Read More »Great Graphic: Measuring Cost of Extend and Pretend
There is a debate. On one hand is Summers, who argues that modern economies have entered an era of secular stagnation. Full utilization of the factors of production and particularly capital and labor is not possible without stimulating aggregate demand in a way that facilitates bubbles. The broad strokes of the argument can be found implicitly or explicitly in much of the commentary and economic analysis. The other side of the debate includes economists like Bernanke, and Rogoff and...
Read More » Swiss Economicblogs.org

