Summary:
When considering the impact of changing currency prices on an economy, trade-weighted measures are appropriate. The Federal Reserve has cited the dollar's appreciation as a headwind on the economy and a depressant on prices. Given the moves in the spot market, and proximity of the G20 meeting, it may be useful to review what has happen to the trade weighted measures of the major currencies. The data is from the Bank of England. It calculates the trade-weighted indices are a broad range of currencies, and updates on a daily basis. It is readily available on Bloomberg, from where the charts are composed. The first Great Graphic shows three currencies (all on a single scale). The US dollar is the yellow line at the top of the chart. Sterling is the white line and the euro is depicted by the green line. The trade-weighted dollar had a big run up that lasted about three quarters through Q1 15. It moved broadly sideways until the middle of last October when it trended higher again. A new cyclical high was seen at the end of last month, which was about 2 percentage points above the March high. However, this month, the dollar's trade-weighted index has fallen by as much as 4.5%. It is still off 3.5% and is at level since in the second half of October. In terms of Fed policy, the decline in the dollar's trade-weighted index reduces significance for monetary policy.
Topics:
Marc Chandler considers the following as important: Featured, FX Trends, Great Graphic, newsletter
This could be interesting, too:
Nachrichten Ticker - www.finanzen.ch writes Die Performance der Kryptowährungen in KW 9: Das hat sich bei Bitcoin, Ether & Co. getan
Nachrichten Ticker - www.finanzen.ch writes Wer verbirgt sich hinter der Ethereum-Technologie?
Martin Hartmann writes Eine Analyse nach den Lehren von Milton Friedman
Marc Chandler writes March 2025 Monthly
When considering the impact of changing currency prices on an economy, trade-weighted measures are appropriate. The Federal Reserve has cited the dollar's appreciation as a headwind on the economy and a depressant on prices.
Given the moves in the spot market, and proximity of the G20 meeting, it may be useful to review what has happen to the trade weighted measures of the major currencies. The data is from the Bank of England. It calculates the trade-weighted indices are a broad range of currencies, and updates on a daily basis. It is readily available on Bloomberg, from where the charts are composed.
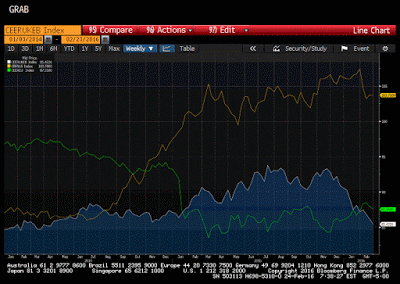
The first Great Graphic shows three currencies (all on a single scale). The US dollar is the yellow line at the top of the chart. Sterling is the white line and the euro is depicted by the green line. The trade-weighted dollar had a big run up that lasted about three quarters through Q1 15. It moved broadly sideways until the middle of last October when it trended higher again. A new cyclical high was seen at the end of last month, which was about 2 percentage points above the March high. However, this month, the dollar's trade-weighted index has fallen by as much as 4.5%. It is still off 3.5% and is at level since in the second half of October.
In terms of Fed policy, the decline in the dollar's trade-weighted index reduces significance for monetary policy. The bar to a March hike is high and even another strong employment report and the recovery in economic activity to above trend here in Q1 are unlikely to spur a follow-up hike.
The Bank of England's broad trade-weighted sterling index is the white line. What is not captured in the chart is that on this metric sterling appreciated a little more than 22% from March 2013 to August 2015. This may help explain some of the disinflationary forces in the UK and the deterioration of its trade balance.
Sterling's TWI fell about 4.5% between last August and October, but recovered into early November. Since then, it has fallen 8.6%. Since February 3, the trade-weighted index has fallen by 3.7%. With a lag, it should boost import prices (and inflation), and may help exports after the J-curve effect runs its course. If, as we expect, the UK remains part of the EU, then the present weakness of sterling enhances the likelihood of a BOE rate hike late this year.
On the BOE's trade-weighted calculation, the euro fell 14.5% from March 2014 through March 2015. It then went broadly sideways before advancing a little more than 6% since the ECB disappointed in early December. The euro has eased in recent days, and the TWI has slipped about 1.8% since February 11. Typically central banks want the TWI to move in the same direction as monetary policy. If it doesn't, the actions by the central bank are being diluted.
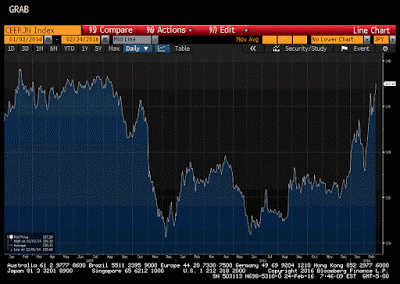
The BOJ must be frustrated. This lower chart depicts the BOE's trade-weighted measure of the Japanese yen. On a TWI basis, the yen declined by nearly 36% between July 2012 and October 2014. As recently as late-June 2015, it was still in its trough.
Since then it has appreciated nearly 14.5% and a little over half of this rise has been registered this month. It is back at August 2014 highs. With the Japanese economy struggling to gain traction, and lowflation still gripping the economy, the BOJ cannot be pleased.
Given the tightening of financial market conditions in Japan, a policy response is likely. Past governments intervened directly in the foreign exchange market. The fact that the Abe government has not intervened is notable and runs contrary to the currency war meme that continues discussed.


