Marc Chandler
April 12, 2016
SNB & CHF
There is a common ploy used by many analysts and reporters that often simply does not stand up to close scrutiny, and would in fact be mocked in the university. The ploy is to take two time series and put them on the same chart but use different scales.
Such a ploy often is used to demonstrate a closer relationship between the two variables than is actually the case. A current example is a chart of the dollar-yen rate and Japanese stocks.
Here is a Great Graphic that was in the...
Read More »
Marc Chandler
April 11, 2016
SNB & CHF
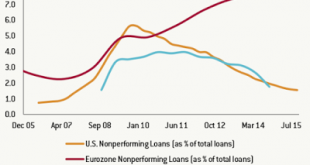
Early in the financial crisis, the US forced all large banks to take an infusion of capital. This helped put a floor under the US financial system. Regulators and stakeholders encouraged US banks to address the significant nonperforming loan problem.
The eurozone banking woes persist. Before the weekend, the shares of the one the largest banks was trading at 25 -year lows. The problem with nonperforming loans though is largely concentrated in the periphery. Italy is moving to...
Read More »
Marc Chandler
April 7, 2016
SNB & CHF
This Great Graphic shows the results of the last three Wall Street Journal survey of business and academic economists on the outlook for Fed policy. The key take away is that despite all the talk and ink spilled on the shifting Fed stance and the split within the FOMC, economists views did not change much over the past month.
In March, 76% of the economists expected the next hike in June. In the April survey that was completed earlier this week found 75% expect a June hike. Only one...
Read More »
Marc Chandler
April 6, 2016
SNB & CHF
The old head and shoulders pattern in the dollar against the yen is back in vogue. We first pointed it out in the first week of January here.
Recall the details. The neckline is drawn around JPY116.30 and measuring objective is near JPY107.00. That target also corresponds to a 38.2% retracement of the big Abe-inspired dollar rally (~JPY106.80). This Great Graphic from Bloomberg shows the pattern.
We note the conflicting flows presently. Portfolio managers continue to be large...
Read More »
Marc Chandler
March 28, 2016
SNB & CHF
This Great Graphic, created on Bloomberg, depicts the CRB Index, a basket of commodity prices. The technical picture has deteriorated, and the price action in the coming sessions is particularly important in determining outlook.
The CRB Index put in a double bottom. On January 20 and February 11 lows were set just below 155.00. The neckline of the double bottom was created in the rally between the two bottoms. It is found near 168.00. The measuring objective is found by...
Read More »
Marc Chandler
March 24, 2016
SNB & CHF
We have been looking for a bottom in the US dollar against the Canadian dollar. It is been difficult, but now it appears that the technicals are turning. This Great Graphic, from Bloomberg, shows that the US dollar is moving above a trend line down off the January 20 high just below CAD1.47.
The downtrend line connects the late February high and the mid-March high. It intersects today near CAD1.3200. The 20-day moving average, the green line, also caught the February and mid-March...
Read More »
Marc Chandler
March 23, 2016
SNB & CHF
The UK referendum is three months away. Three-month options are a common benchmark for various market segments; from speculators, to fund managers to corporations. Events over the past week have raised the risks that the UK votes to leave the EU.
The market has responded forcefully today, and even if you only follow the spot market, what is happening in the options market is significant. First, three-month volatility has jumped 2.6 percentage points to 14.5%. It appears to be the...
Read More »
Marc Chandler
March 22, 2016
SNB & CHF
Until last September, the Federal Reserve seems to play down the market-based measures of inflation expectations, preferring the surveys that showed views were anchored. At the September 2015 FOMC meeting where the Fed had been expected to tighten until the August turmoil, officials cited among other considerations, the decline in market-based measures of inflation expectations.
There are many problems with using the spread between conventional Treasuries and the inflation-linked...
Read More »
Marc Chandler
March 17, 2016
SNB & CHF
The cry that the dollar has peaked is gaining ground. We are not convinced. The macro-fundamental case remains intact. Divergence between the US and other high income countries continues, even if at a more gradual pace than the Federal Reserve expected a few months ago.
This Great Graphic of the Dollar Index, created on Bloomberg, shows that shows the broad consolidation over the past year continues to hold. The break of 95.00 today seems to point to a test on the low from last...
Read More »
Marc Chandler
March 11, 2016
SNB & CHF
The Canadian dollar's advance continues. Neither the widening of interest rate differentials in the US favor nor a poor employment report has managed to buckle the Loonie. Oil and the general risk-on mood trump the other concerns.
In addition, investors are concluding that fiscal stimulus will reduce the possibility of additional monetary stimulus. The implied yield on the June BA futures is now the highest since last June.
The Great Graphic, made on Bloomberg shows the greenback's...
Read More »
 Swiss Economicblogs.org