Saturday , April 20 2024
Home / Tag Archives: Chart Update (page 2)

Tag Archives: Chart Update

Change is in the Air – Precious Metals Supply and Demand

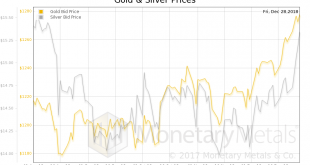
Fundamental Developments: Physical Gold Scarcity Increases Last week, the price of gold rose $25, and that of silver $0.60. Is it our turn? Is now when gold begins to go up? To outperform stocks? Something has changed in the supply and demand picture. Let’s look at that picture. But, first, here is the chart of the prices of gold and silver. Gold and Silver Price(see more posts on gold price, silver price, )Gold and...

Read More »

The Recline and Flail of Western Civilization and Other 2019 Predictions

The Recline and Flail of Western Civilization and Other 2019 Predictions “I think it’s a tremendous opportunity to buy.  Really a great opportunity to buy.” – President Donald Trump, Christmas Day 2018 Darts in a Blizzard Today, as we prepare to close out the old, we offer a vast array of tidings.  We  bring words of doom and despair.  We bring words of contemplation and reflection.  And we also bring words of hope...

Read More »

The Big Picture: Paper Money vs. Gold

Numbers from Bizarro-World The past few months have been really challenging for anyone invested in gold or silver; for me personally as well. Despite serious warning signs in the economy, staggering debt levels and a multitude of significant geopolitical threats at play, the rally in risk assets seemed to continue unabated. In fact, I was struggling with this seeming paradox myself. As I kept looking at the state of...

Read More »

A Global Dearth of Liquidity

Worldwide Liquidity Drought – Money Supply Growth Slows Everywhere This is a brief update on money supply growth trends in the most important currency areas outside the US (namely the euro area, Japan and China)  as announced in in our recent update on US money supply growth (see “Federal Punch Bowl Removal Agency” for the details). The liquidity drought is not confined to the US – it is fair to say that it is a global...

Read More »

Eastern Monetary Drought

  Smug Central Planners Looking back at the past decade, it would be easy to conclude that central planners have good reason to be smug. After all, the Earth is still turning. The “GFC” did not sink us, instead we were promptly gifted the biggest bubble of all time –  in everything, to boot. We like to refer to it as the GBEB (“Great Bernanke Echo Bubble”) in order to make sure its chief architect is not forgotten....

Read More »

Is the Canary in the Gold Mine Coming to Life Again?

A Chirp from the Deep Level Mines Back in late 2015 and early 2016, we wrote about a leading indicator for gold stocks, namely the sub-sector of marginal – and hence highly leveraged to the gold price – South African gold stocks. Our example du jour at the time was Harmony Gold (HMY) (see “Marginal Producer Takes Off” and “The Canary in the Gold Mine” for the details). Mining engineer equipped with bio-sensor ...

Read More »

You Can’t Eat Gold – Precious Metals Supply and Demand

You Actually Can Eat Gold, But Its Nutritional Value is Dubious “You can’t eat gold.” The enemies of gold often unleash this little zinger, as if it dismisses the idea of owning gold and indeed the whole gold standard. It is a fact, you cannot eat gold. However, it dismisses nothing. This gives us an idea. Let us tie three facts together. One, you can’t eat gold. Two, gold is in backwardation in Switzerland. And three,...

Read More »

Are Credit Spreads Still a Leading Indicator for the Stock Market?

A Well-Established Tradition Seemingly out of the blue, equities suffered a few bad hair days recently. As regular readers know, we have long argued that one should expect corrections in the form of mini-crashes to strike with very little advance warning, due to issues related to market structure and the unique post “QE” environment. Credit spreads are traditionally a fairly reliable early warning indicator for stocks...

Read More »

Fed Credit and the US Money Supply – The Liquidity Drain Accelerates

Federal Reserve Credit Contracts Further We last wrote in July about the beginning contraction in outstanding Fed credit, repatriation inflows, reverse repos, and commercial and industrial lending growth, and how the interplay between these drivers has affected the growth rate of the true broad US money supply TMS-2 (the details can be seen here: “The Liquidity Drain Becomes Serious” and “A Scramble for Capital”)....

Read More »

In Gold We Trust – Incrementum Chart Book 2018

The Most Comprehensive Collection of Charts Relevant to Gold is Here Our friends from Incrementum (a European asset management company) have just released the annual “In Gold We Trust” chart book, which collects a wealth of statistics and charts relevant to gold, with extensive annotations. Many of these charts cannot be found anywhere else. The chart book is an excellent reference work for anyone interested in the...

Read More »