Fundamental Developments: Physical Gold Scarcity Increases Last week, the price of gold rose , and that of silver %excerpt%.60. Is it our turn? Is now when gold begins to go up? To outperform stocks? Something has changed in the supply and demand picture. Let’s look at that picture. But, first, here is the chart of the prices of gold and silver. Gold and Silver Price(see more posts on gold price, silver price, )Gold and silver priced in USD – the final week of the year was good to the precious metals. As an aside: January is the seasonally strongest month for silver. [PT] - Click to enlarge Next, this is a graph of the gold price measured in silver, otherwise known as the gold to silver ratio (see here for an
Topics:
Keith Weiner considers the following as important: 6) Gold and Austrian Economics, Chart Update, dollar price, Featured, Gold and its price, gold basis, Gold co-basis, gold price, gold silver ratio, newsletter, Precious Metals, silver basis, Silver co-basis, silver price
This could be interesting, too:
Nachrichten Ticker - www.finanzen.ch writes Die Performance der Kryptowährungen in KW 9: Das hat sich bei Bitcoin, Ether & Co. getan
Nachrichten Ticker - www.finanzen.ch writes Wer verbirgt sich hinter der Ethereum-Technologie?
Martin Hartmann writes Eine Analyse nach den Lehren von Milton Friedman
Marc Chandler writes March 2025 Monthly
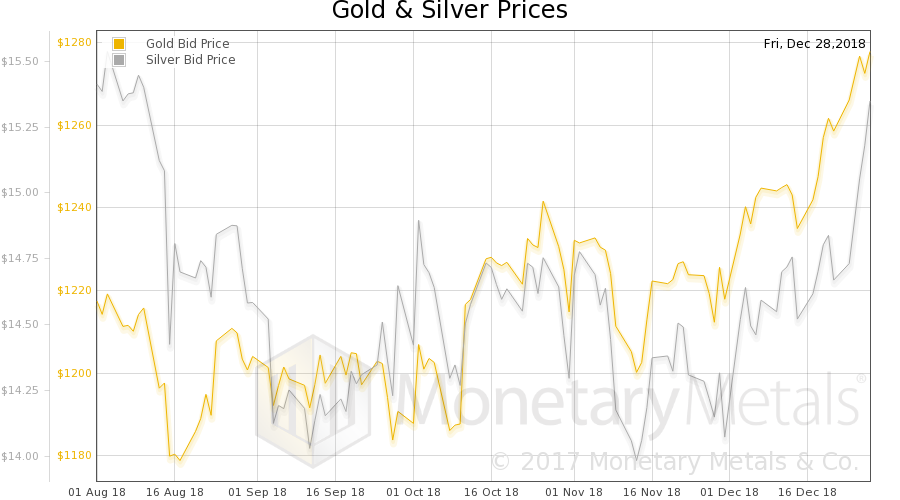
Fundamental Developments: Physical Gold Scarcity IncreasesLast week, the price of gold rose $25, and that of silver $0.60. Is it our turn? Is now when gold begins to go up? To outperform stocks? Something has changed in the supply and demand picture. Let’s look at that picture. But, first, here is the chart of the prices of gold and silver. |
Gold and Silver Price(see more posts on gold price, silver price, ) |
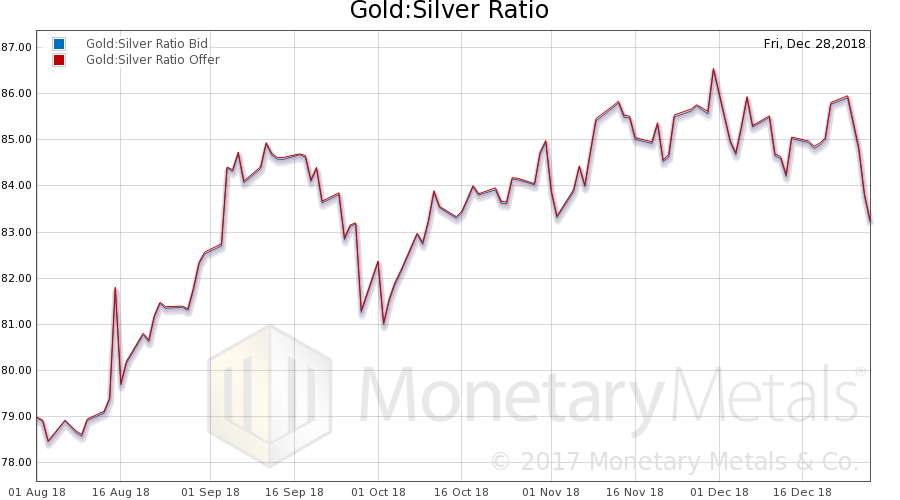
| Next, this is a graph of the gold price measured in silver, otherwise known as the gold to silver ratio (see here for an explanation of bid and offer prices for the ratio). It fell sharply this week. |
Gold:Silver Ratio(see more posts on gold silver ratio, ) |
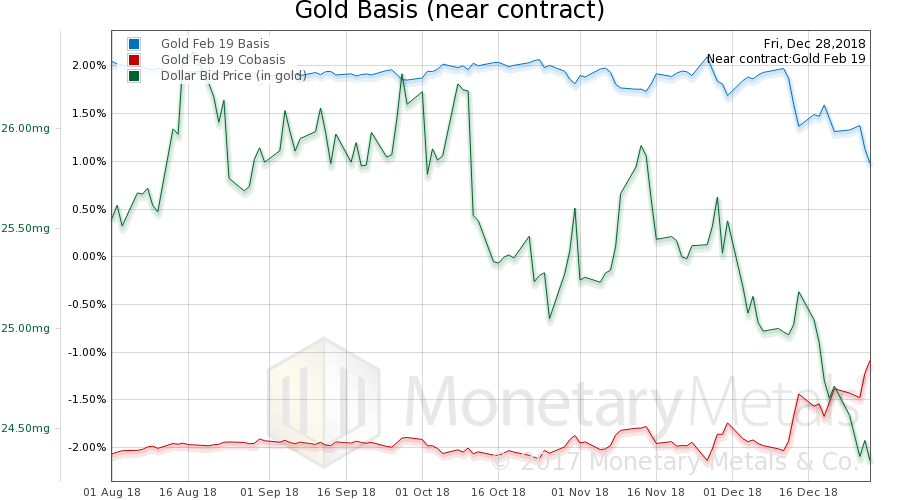
| Here is the gold graph showing gold basis, co-basis and the price of the dollar in terms of gold price.
Notice the price of the dollar (i.e., the inverse of the price of gold, measured in dollars) moving opposite to the scarcity of gold (i.e., the co-basis). Gold is becoming scarcer to the market, while its price is rising. This is not a move driven by leveraged speculators arbitraging their gold market to stock market expectations or Wall Street betting that gold will go up when stocks go down. Or at least not only that. There is buying of metal here. The Monetary Metals Gold Fundamental Price rose another $18 to $1,325. |
Gold Basis and Co-basis and the Dollar Price(see more posts on dollar price, gold basis, Gold co-basis, ) |
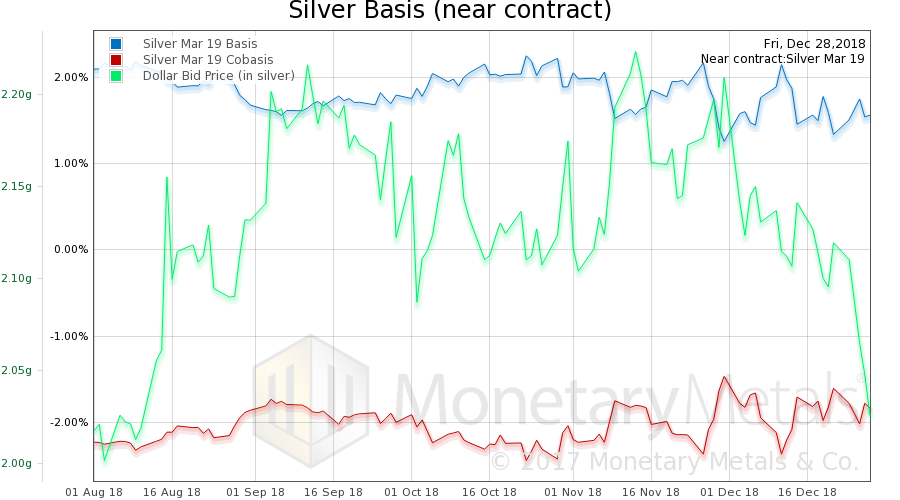
| Now let’s look at silver.
In silver, we see a similar trend. We had a much bigger price change proportionally. And the co-basis dropped, but not a lot. There is buying of silver metal too. And like in gold, the Monetary Metals Silver Fundamental Price rose 68 cents, to $15.79. It makes sense, in our broken monetary system, that if people perceive the stock market as having topped many people may begin to turn to precious metals in the hope they may become the next bubble. Others begin to heed the now out-of-fashion idea of having some money set aside, apart from their portfolio. If the Fed’s Great Bull Market falters, then maybe the Fed is not omnipotent and it makes sense to reduce risk? |
Silver Basis and Co-basis and the Dollar Price(see more posts on dollar price, silver basis, Silver co-basis, ) |
Whatever the reasons, we think the stars may be aligning. Stay tuned!
Charts by Monetary Metals
Chart captions by PT
Tags: Chart Update,dollar price,Featured,gold basis,Gold co-basis,gold price,gold silver ratio,newsletter,Precious Metals,silver basis,Silver co-basis,silver price


