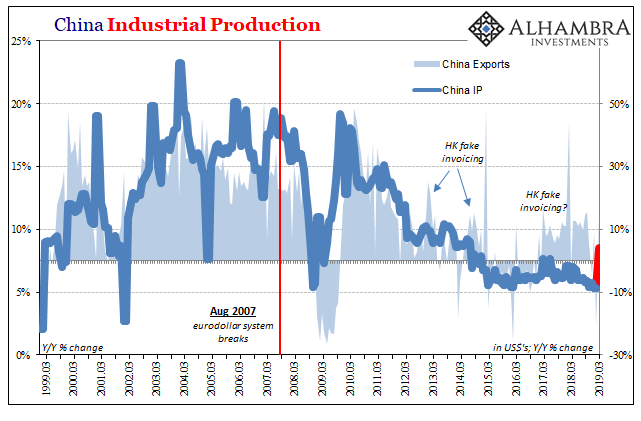
It had been 55 months, nearly five years since China’s vast and troubled industrial sector had seen growth better than 8%. Not since the first sparks of the rising dollar, Euro$ #3’s worst, had Industrial Production been better than that mark. What used to be a floor had seemingly become an unbreakable ceiling over this past half a decade. According to Chinese estimates, IP in March 2019 was 8.5% more than it was in March 2018. That was far more than was expected, and much improved from February’s record low. It was so far above what anyone was thinking, and sharply contrasts with recent data on Chinese imports (four straight monthly negatives), the blowout (or what counts for one nowadays) isn’t being uniformly
Topics:
Jeffrey P. Snider considers the following as important: 5) Global Macro, China, China Industrial Production, currencies, economy, fai, Featured, Federal Reserve/Monetary Policy, fiscal stimulus, fixed asset investment, industrial production, IP, manufacturing, Markets, newsletter, Retail sales, stimulus
This could be interesting, too:
Nachrichten Ticker - www.finanzen.ch writes Die Performance der Kryptowährungen in KW 9: Das hat sich bei Bitcoin, Ether & Co. getan
Nachrichten Ticker - www.finanzen.ch writes Wer verbirgt sich hinter der Ethereum-Technologie?
Martin Hartmann writes Eine Analyse nach den Lehren von Milton Friedman
Marc Chandler writes March 2025 Monthly
| It had been 55 months, nearly five years since China’s vast and troubled industrial sector had seen growth better than 8%. Not since the first sparks of the rising dollar, Euro$ #3’s worst, had Industrial Production been better than that mark. What used to be a floor had seemingly become an unbreakable ceiling over this past half a decade.
According to Chinese estimates, IP in March 2019 was 8.5% more than it was in March 2018. That was far more than was expected, and much improved from February’s record low. It was so far above what anyone was thinking, and sharply contrasts with recent data on Chinese imports (four straight monthly negatives), the blowout (or what counts for one nowadays) isn’t being uniformly treated as the usual seasonal green shoot. Along with Q1 2019 GDP which remained steady at 6.4% rather than decelerating slightly as was expected, there isn’t nearly as much consensus about what’s going on. |
China Industrial Production 1999-2019(see more posts on China Industrial Production, ) |
Some, of course, see it as the surefire bottom:
Others remain skeptical:
|
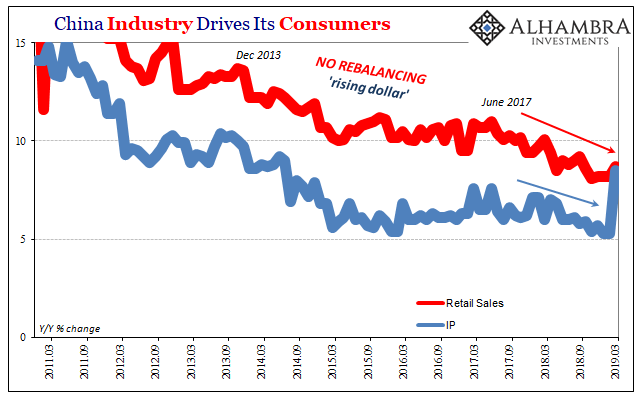
China Industry Drives Its Consumers, 2011-2019 |
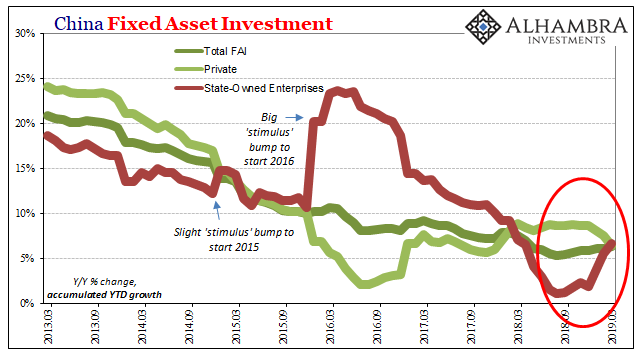
| While March’s IP number is a clear outlier there is the detectible presence of that stimulus. In the all-important Fixed Asset Investment category, or FAI, spending on infrastructure and building by state-owned businesses has increased. After cutting back throughout 2018, the government has directed more activity (wasteful or not) via the usual fiscal channel.
On an accumulated basis, according to China’s National Bureau of Statistics, FAI via state-owned firms rose 6.7% year-over-year January through March. That’s the highest accumulated growth rate since January-February 2018. It’s also noticeably greater than the middle of last year when government-directed FAI had pretty much stopped increasing. |
China Fixed Asset Investment, 2013-2019 |
| While that is certainly “stimulus” as Economists call it, it’s hardly what many have been calling for and expecting – paling in comparison to the “stimulus” panic of 2016. Authorities clearly don’t want the economy plunging into the “hard landing” everyone is worried about, but they also aren’t willing to just throw everything at the problem like they once did.
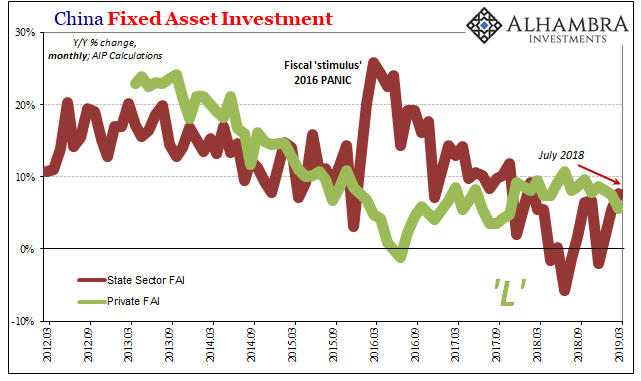
And it is the private side of FAI which shows what that problem is. On an accumulated basis, Private FAI increased by just 6.4% year-over-year January-March. For March alone (converting an accumulated rate to a single month’s estimate requires a simple calculation which the government data doesn’t provide), Private FAI was just 5.6% more than in March 2018. That’s the lowest rate since November 2017. More importantly, the slightly uptick in private FAI which began in the middle of 2016 seems to have run out by the middle of 2018. Since last summer, private capex investment, the key component to Chinese economic growth as well as its demographic shift (urbanization), has stalled again already at a historically low level. Contrasting with IP, Private FAI had accelerated to the downside in March. |
China Fixed Asset Investment, 2012-2019 |
In other words, the Communist government is intent on doing something about this renewed downtrend but it’s nowhere near the level of action as three years ago. In fact, even as State-owned FAI rises a bit from the low point last year what looks like stimulus is itself a historically low level of growth.
What this suggests about the goal for it is managed decline; not a rebound and recovery. At best, Chinese economic authorities are hoping for the economy to stabilize here at historically low growth rates before it gets even worse. The IP number might fit in that view if it suggests something more than a single month’s outlier.
The IP figure also fits this mismatch between descriptions noted above. For those thinking actual recovery, a big jump from record low to first time over 8% in almost five years would be, if confirmed in subsequent months, consistent with the idea. Unfortunately, neither retail sales nor private FAI suggest something like that. March IP is an outlier in its own series as well as among the rest of them.
Not getting worse isn’t quite the same as getting better. While this argument ultimately attempts to define the upside (is there even any?), the rest of the Chinese data still presents much the same downside risks.
It’s funny, unlike last week with a single small positive export number markets aren’t flipping out about China’s blowout IP (and stable GDP). It’s as if it is too good to be more reasonably considered a green shoot.
Tags: China,China Industrial Production,currencies,economy,fai,Featured,Federal Reserve/Monetary Policy,fiscal stimulus,fixed asset investment,industrial production,IP,manufacturing,Markets,newsletter,Retail sales,stimulus


