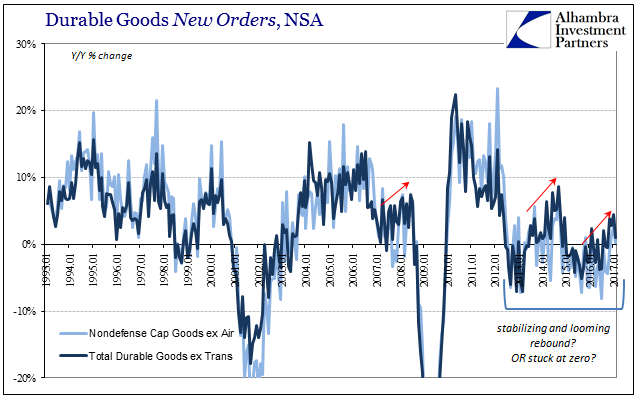
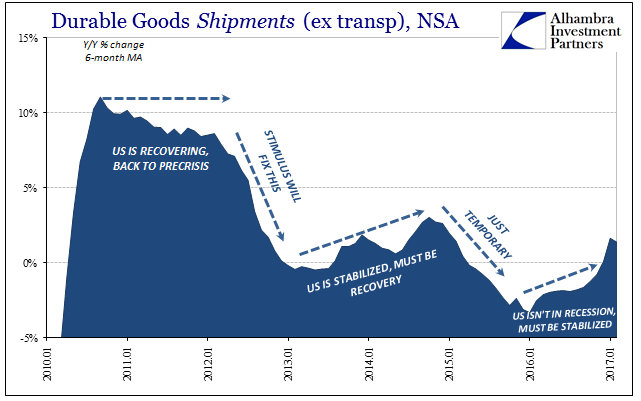
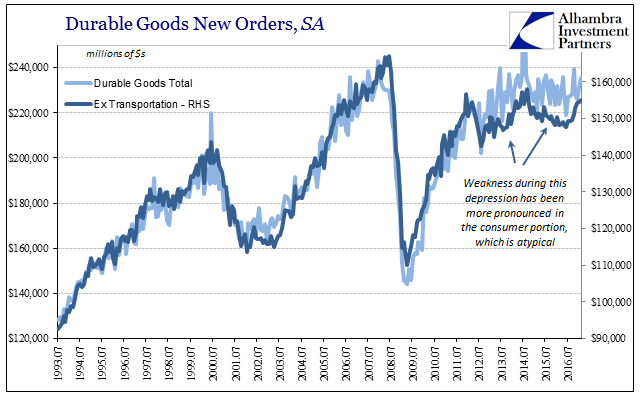
New orders for durable goods (not including transportation orders) were up 1% year-over-year in February. That is less than the (revised) 4.4% growth in January, but as with all comparisons of February 2017 to February 2016 there will be some uncertainty surrounding the comparison to the leap year version. That would suggest that orders as well as shipments were somewhat better than they appear at least in in terms of the rate of change. Durable goods shipments (ex transportation) were barely positive at just 0.3%, which once more raises doubts about what might be meant by “better.” If on a comparable basis durable goods orders were up 5% rather than 1%, there still isn’t any meaningful distance between the two rates. That is, in fact, what the seasonally-adjusted series suggests was the increase in February, taking into account that 29th day last year through the Census Bureau’s auto-regressive factors. However, the same seasonally-adjusted set also calculates new orders contracted ever so slightly in January rather than the 4.4% growth rate indicated by the unadjusted figures. Again, what all these conflicting results tell us is that nothing really has changed as far as durable goods, and the consumer and wider economy by extension.
Topics:
Jeffrey P. Snider considers the following as important: Business cycle, capital goods, China, consumer spending, currencies, depression, Dollar, durable goods, economy, EuroDollar, eurodollar standard, Featured, Federal Reserve/Monetary Policy, industrial production, manufacturing recession, Markets, Monetary Policy, newsletter, QE, Recession, The United States, trade, ZIRP
This could be interesting, too:
Nachrichten Ticker - www.finanzen.ch writes Die Performance der Kryptowährungen in KW 9: Das hat sich bei Bitcoin, Ether & Co. getan
Nachrichten Ticker - www.finanzen.ch writes Wer verbirgt sich hinter der Ethereum-Technologie?
Martin Hartmann writes Eine Analyse nach den Lehren von Milton Friedman
Marc Chandler writes March 2025 Monthly
New orders for durable goods (not including transportation orders) were up 1% year-over-year in February. That is less than the (revised) 4.4% growth in January, but as with all comparisons of February 2017 to February 2016 there will be some uncertainty surrounding the comparison to the leap year version. That would suggest that orders as well as shipments were somewhat better than they appear at least in in terms of the rate of change. Durable goods shipments (ex transportation) were barely positive at just 0.3%, which once more raises doubts about what might be meant by “better.”
| If on a comparable basis durable goods orders were up 5% rather than 1%, there still isn’t any meaningful distance between the two rates. That is, in fact, what the seasonally-adjusted series suggests was the increase in February, taking into account that 29th day last year through the Census Bureau’s auto-regressive factors. However, the same seasonally-adjusted set also calculates new orders contracted ever so slightly in January rather than the 4.4% growth rate indicated by the unadjusted figures. Again, what all these conflicting results tell us is that nothing really has changed as far as durable goods, and the consumer and wider economy by extension.
For now, that point will have to remain partially obscured by calendar effects, though in reality even factoring them on an ad hoc, nonstandard basis we arrive at the same place as where oil prices, the eurodollar curve, or JPY are already indicating. |
Durable Goods New Orders, NSA 1993-2017 |
Durable Goods Shipments (ex transp), NSA 2010-2017 |
|
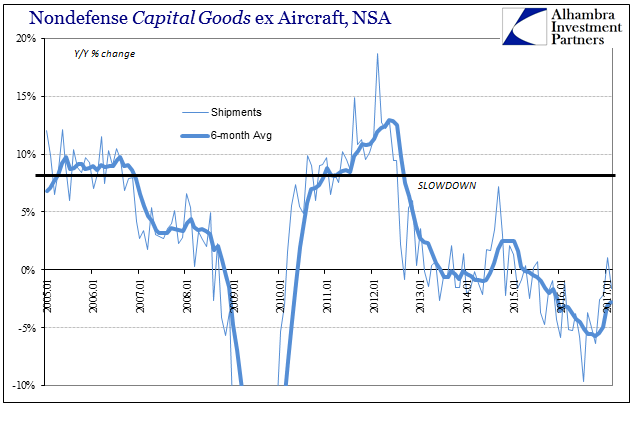
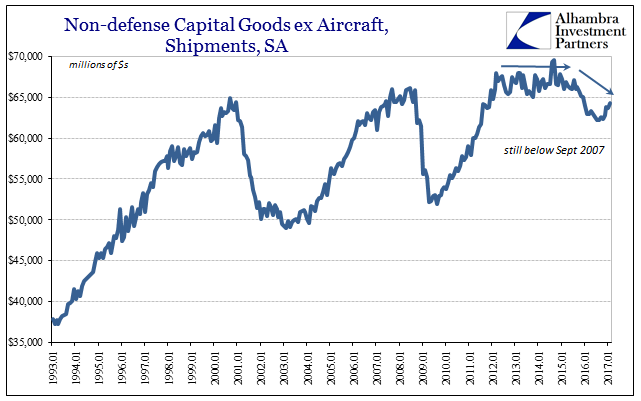
| Capital goods shipments fell nearly 2%, after rising by just 1% in January (though that was the first positive number in seventeen months). Thus, despite whatever February effects there is considerably less doubt about the state of capex than there might appear to be about durable goods overall. |
Nondefense Capital Goods ex Aircraft, NSA 2005-2017 |
Non-defense Capital Goods ex Aircraft, Shipments, SA 1993-2017 |
|
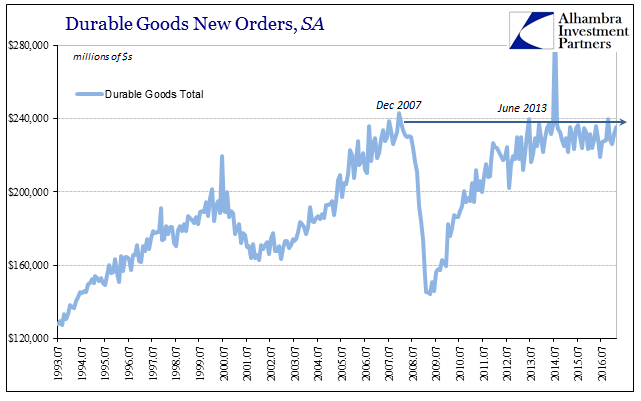
| In the bigger picture, we see more clearly how these minor differences are truly minor if not completely indistinguishable. The consumer goods segment has come back somewhat since September last year, but overall durable goods remain as if in stasis dating back now almost four years. |
Durable Goods New Orders, SA 1993-2016 |
| Worse, that four years of sideways has occurred at a level slightly less than the prior cycle peak; meaning that the economy shrunk after that point and continues to do so on the more important non-linear basis (lack of growth, robust growth, is contraction). |
Durable Goods New Orders, SA |
Though conditions this year are improved as compared to this time last year, none of the economic accounts so far including durable goods register anything more than a sign change. The manufacturing economy may no longer be in recession after two years or more of it, but that isn’t turning out to be what people seem to think it should be. But those expectations are wrong now, and more importantly have been for years. In truth, durable goods with or without February 29, 2016, are as consistent today as they have been going back to 2013 (or 2012 in the case of other statistics).
There is no growth, and no indication as yet that there will be.
Tags: Business Cycle,capital goods,China,consumer spending,currencies,depression,dollar,durable goods,economy,EuroDollar,eurodollar standard,Featured,Federal Reserve/Monetary Policy,industrial production,manufacturing recession,Markets,Monetary Policy,newsletter,QE,recession,Trade,ZIRP

