Overview The euro has lost some momentum versus the franc, the main reason is as usual monetary policy: Draghi does not want to talk about an early end of his bond buying programming at Jackson Hole. This had been confirmed by economic data: only 1.2% core inflation compared to a long-term inflation target of 2%. Consequently the Swissie appreciated during the week. Eurozone Core Consumer Price Index (CPI) YoY, Jul 2017(see more posts on Eurozone Core Consumer Price Index, ) Source: Investing.com - Click to enlarge . EUR/CHF Still the euro is up 3% in the last 30 days against CHF, but this appreciation had already reached 5% (hence nearly 1.15 CHF). USD/CHF and Jackson Hole The Jackson Hole gathering is
Topics:
George Dorgan considers the following as important: Australian Dollar, Bollinger Bands, British Pound, Canadian Dollar, Crude Oil, EUR/CHF, EUR/USD, Euro, Euro Dollar, Featured, FX Trends, GBP/USD, Japanese Yen, MACDs Moving Average, newsletter, RSI Relative Strength, S&P 500 Index, S&P 500 Index, Stochastics, Swiss Franc Index, U.S. Dollar Index, U.S. Treasuries, USD/CHF, USDJPY
This could be interesting, too:
RIA Team writes The Importance of Emergency Funds in Retirement Planning
Nachrichten Ticker - www.finanzen.ch writes Gesetzesvorschlag in Arizona: Wird Bitcoin bald zur Staatsreserve?
Nachrichten Ticker - www.finanzen.ch writes So bewegen sich Bitcoin & Co. heute
Nachrichten Ticker - www.finanzen.ch writes Aktueller Marktbericht zu Bitcoin & Co.
OverviewThe euro has lost some momentum versus the franc, the main reason is as usual monetary policy:
This had been confirmed by economic data:
Consequently the Swissie appreciated during the week. |
Eurozone Core Consumer Price Index (CPI) YoY, Jul 2017(see more posts on Eurozone Core Consumer Price Index, )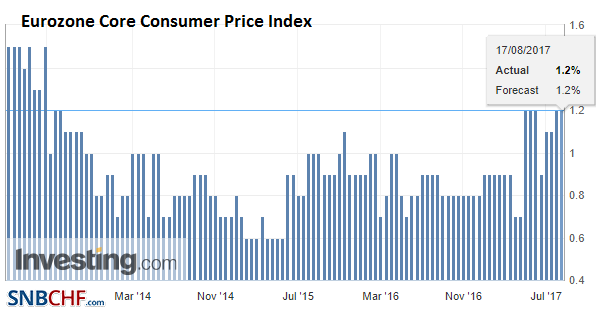 Source: Investing.com - Click to enlarge . |
EUR/CHFStill the euro is up 3% in the last 30 days against CHF, but this appreciation had already reached 5% (hence nearly 1.15 CHF).
USD/CHF and Jackson HoleThe Jackson Hole gathering is an annual event. It is true that there have been a few times, where officials used that forum to send a meaningful signal to investors, but this is the exception. The topic this year is “Fostering a Dynamic Global Economy.” It never seemed particularly reasonable to us to expect ECB President Draghi to use this forum, which he has not attended for a few years, to give some fresh policy clues. That said, many, if not most, are expecting that the ECB will announce it will continue to buy assets, but starting next year, it will do so at a reduced pace. Currently, they are buying 60 bln euros a month, and it may be reduced to 30 bln.
Fed Chair Yellen will also speak at Jackson Hole. A consensus among the Fed appears to have emerged to announce the reduction the balance sheet in September to be implemented beginning in Q4. A September hike has not been anticipated for several months, but a recent WSJ survey found 75% of economists expect a move in December. NY Fed’s Dudley recently indicated that he could support a hike at before the end of the year provided the economy continues to evolve as the Fed expects. We do not anticipate that Yellen will contradict this general view. In the recent past, Yellen has argued for greater integration of women in the work force to facilitate a more dynamic economy. The FOMC minutes came out hard against legislative efforts to dilute bank regulations and this could be repeated at Jackson Hole insofar as of US banks have demonstrated in deed if not word that regulation is not necessarily antithetical to growth and profitability. |
EUR/CHF and USD/CHF, August 19(see more posts on EUR/CHF, USD/CHF, )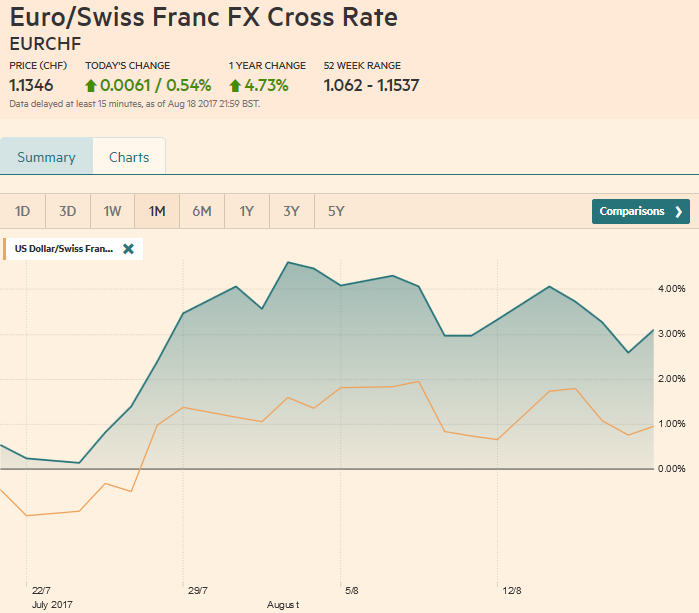 Source: markets.ft.com - Click to enlarge |
Swiss Franc Currency Index (3 years)The Swiss Franc index is the trade-weighted currency performance (see the currency basket)On a three years interval, the Swiss Franc had a weak performance. The dollar index was far stronger. The dollar makes up 33% of the SNB portfolio and 25% of Swiss exports (incl. countries like China or Arab countries that use the dollar for exchanges).
|
Swiss Franc Currency Index (3 years), August 19(see more posts on Swiss Franc Index, )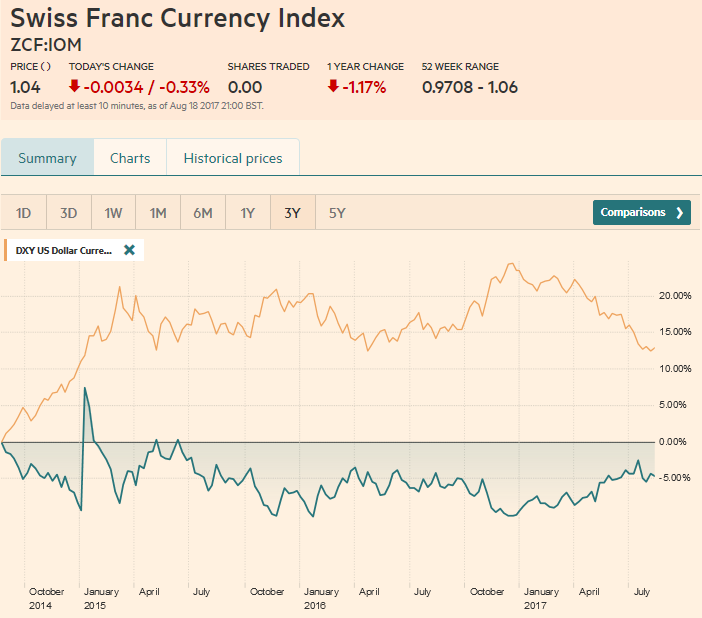 Source: markets.ft.com - Click to enlarge |
US Dollar IndexThe US dollar began consolidating earlier this month after trending lower since the start of the year. We expected this phase to draw to a close shortly. The Fed’s Jackson Hole Symposium (August 24-26) was going to mark the end of the lull. The US employment data is released a week later and the ECB meeting a week after that. The FOMC meeting is a fortnight later.
The Dollar Index pared its week’s gain ahead of the weekend and closed 0.4% higher. The market attempted to push it through 94.00, and although some intra-day penetration took place, it failed to closed above it and some profit-taking was seen, The five-day moving average crossed above the 20-day average for the first time since late June, but the risk is of being whipsawed. The technical indicators are out of sync. The RSI has been easing over the past few sessions. The Slow Stochastics have turned down, while the MACDs are still trending higher. A trend line is drawn off the Aug 2 low (~92.55), the Aug 4 low (~92.70), and Aug 11 low (~92.94) will start the new week near 93.20. |
US Dollar Currency Index, August 19(see more posts on U.S. Dollar Index, )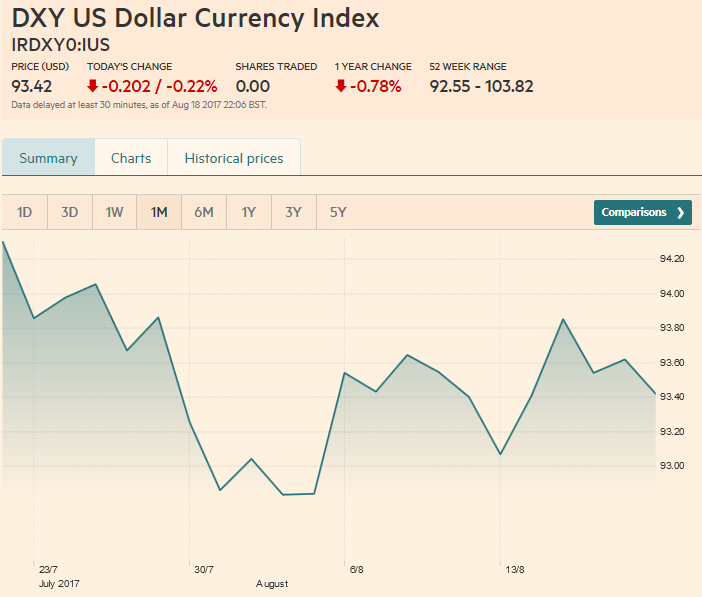 Source: markets.ft.com - Click to enlarge |
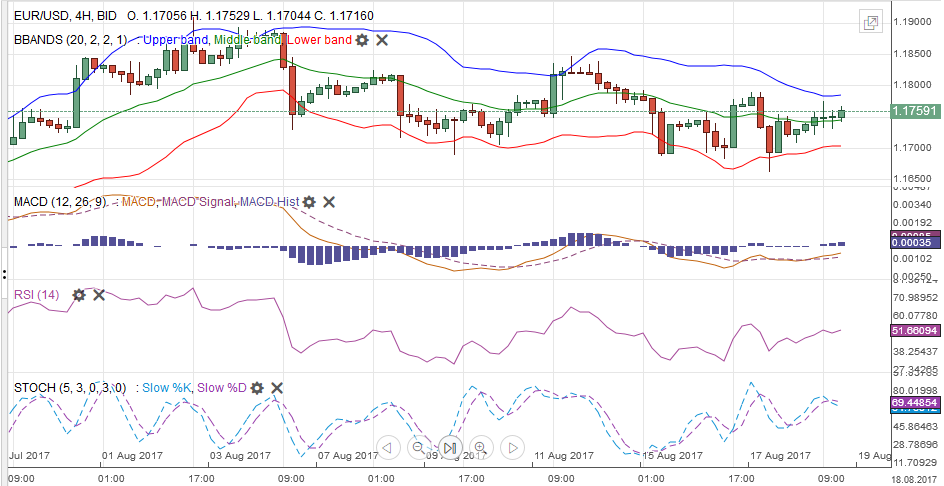
EUR/USDThe euro has also been trending gently lower since August 2. The downtrend line off the recent high comes in a little below $1.18 at the start of the new week. The low for the move is near $1.1660 and was seen after the record of the ECB meeting expressed concern about the “possible” euro “overshoot” in the “future.” However, the euro did not close below $1.1680, the 38.2% retracement of the leg up in the euro that began in early July. The technical indicators appear aligned for further consolidation. |
EUR/USD with Technical Indicators, August 19(see more posts on Bollinger Bands, EUR/USD, MACDs Moving Average, RSI Relative Strength, Stochastics, ) |
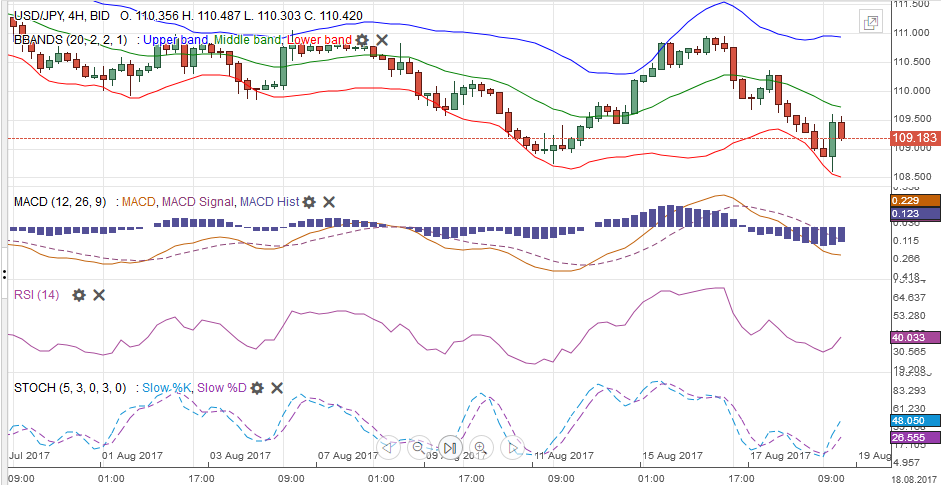
USD/JPYThe dollar fell against the yen for the past three sessions. The two days of gains at the start of the week lifted the dollar to JPY111, the high seen earlier this month, and those gains interrupted a four-day decline of the previous week. By the end of the week, the greenback was flirting the lower end of the range since last November. The dollar reached JPY108.60 before the weekend. The low from April was near JPY108.10 and the low in June was near JPY108.85. The JPY107.85 area corresponds to the 61.8% retracement of the rally since the spike low last November (~JPY101.20). In terms of a correction of the entire Abenomics era move, the JPY106.60 area is the 38.2% retracement. |
USD/JPY with Technical Indicators, August 19(see more posts on Bollinger Bands, MACDs Moving Average, RSI Relative Strength, Stochastics, USD/JPY, ) |
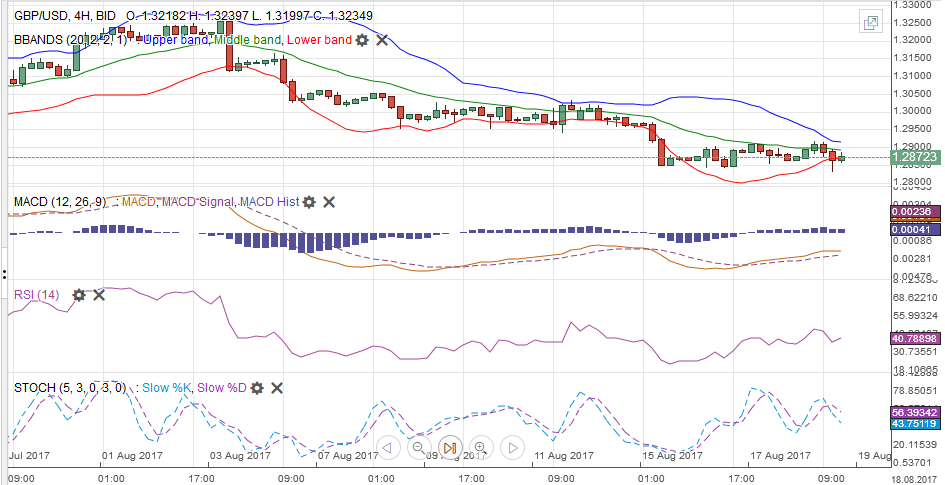
GBP/USDSterling tested a five-month trend line that comes in around $1.2840 in the middle of last week. Recall that sterling closed well last week, but there was no follow through buying, and despite a mostly stable tone in the second half of last week, it was the weakest of the majors, losing about 1.1% against the dollar and 0.6% against the euro. Initial resistance is seen in the $1.2925-$1.2975 area. Support is seen the $1.2800-$1.2825. Sterling is also poised to fall further against the euro. |
GBP/USD with Technical Indicators, August 19(see more posts on Bollinger Bands, GBP/USD, MACDs Moving Average, RSI Relative Strength, Stochastics, ) |
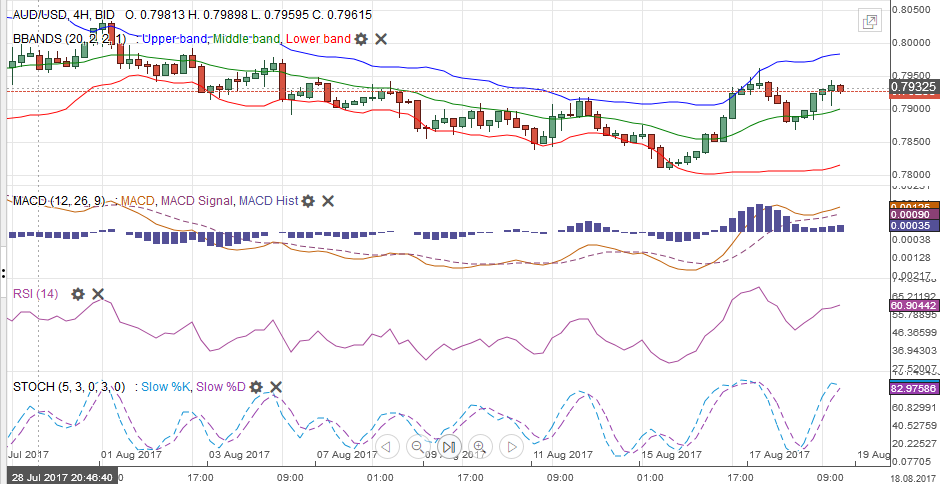
AUD/USDThe Australian dollar may have also completed its downside correction on August 15 ahead of $0.7800, meeting a 50% retracement objective of the rally since early July. Although the Aussie briefly poked above $0.7950, it failed to sustain the move. The RSI and Slow Stochastics suggest the market will likely succeed next week. The MACDs have turned higher but likely will next week. |
AUD/USD with Technical Indicators, August 19(see more posts on Australian Dollar, Bollinger Bands, MACDs Moving Average, RSI Relative Strength, Stochastics, ) |
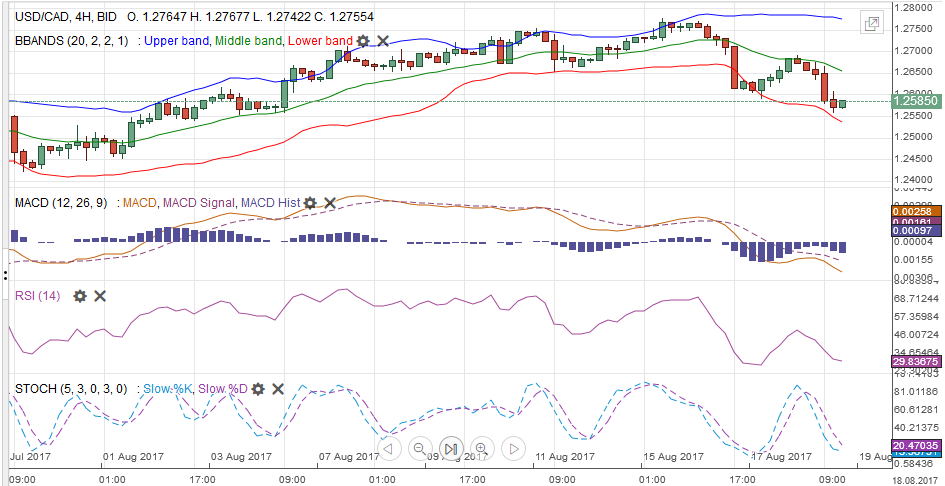
USD/CADThe Canadian dollar was the strongest of the major currencies over the past week, rising nearly 0.75% against the US dollar. The US dollar fell against the Canadian dollar twice during the past five sessions, but those two days more than offset the gains of the other three sessions. The slightly firmer underlying July inflation measures saw the Canadian dollar trade on both sides of the previous day’s range, with the US dollar falling to a two-week low of CAD1.2575. The US dollar closed the below the previous day’s low, meeting the definition of an outside down day. Note that same pattern is also now on the weekly bar charts. The US dollar recorded an outside down week. Technically it is understood to be bearish. The dollar bounce that began around July 26 faded near CAD1.2770. To boost the odds that this is the corrective high, the CAD1.2550 area may need to be convincingly violated. |
USD/CAD with Technical Indicators, August 19(see more posts on Bollinger Bands, Canadian Dollar, MACDs Moving Average, RSI Relative Strength, Stochastics, ) |
Crude OilOctober light sweet crude oil fell nearly a little more than 0.5% last week after what reportedly was as short squeeze, saw prices rally 3% before the weekend. No fresh developments seemed behind the sudden rise, the most in a month. The pre-weekend rally stalled near the 20-day average near $48.75. The 61.8% retracement of this month’s losses is near $49. The October contract bottomed on June 21 near $42.50. It peaked near $50.50 in early August and retested it on August 10, when it recorded an outside down day. |
Crude Oil, August 2016 - August 2017(see more posts on Crude Oil, )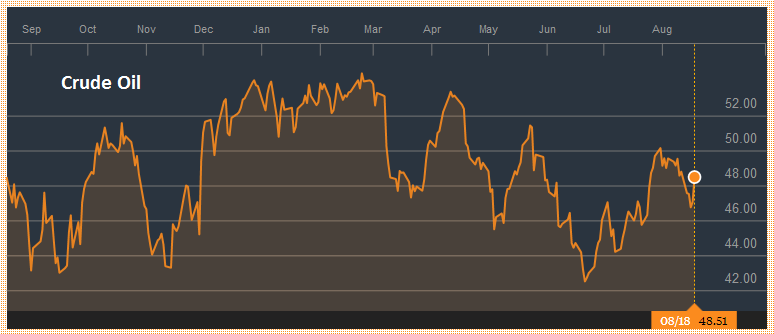 Source: bloomberg.com - Click to enlarge |
U.S. TreasuriesThe US 10-year yields steady last week, ending a two-week decline. The yield is about 10 bp lower than it had finished July. There is some congestion from May and June that extends closer to 2.10%. If the Trump trade (or what at least one journalist suggest is the Cohn trade) is being unwound, recall that the US 10-year yield was averaging close to 1.80% in the month before the US election last November. Before the weekend, the September 10-year note futures poked above 127-00. It has only done this two other sessions this year and was rebuffed. Some minor bearish divergence was appearing in the technical indicators which did not confirm the end of the week rally. A break of 126-00 may need to signal anything of technical significance. |
Yield US Treasuries 10 years, August 2016 - August 2017(see more posts on U.S. Treasuries, )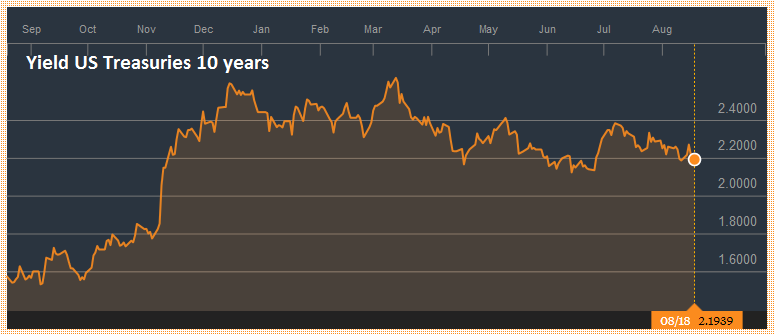 Source: bloomberg.com - Click to enlarge |
S&P 500 IndexThe S&P 500 fell nearly two-thirds of a percent last week. It was the second weekly decline. The loss on August 17 of 1.5% was the second largest of the year. The S&P 500 gapped lower before the weekend and quickly filled the gap. That initial pre-weekend loss was sufficient to fill another gap from mid-July. It also tested the year’s uptrend that we draw off a couple of lows in January and the May low. It was near 2419 before the weekend and near 2425 at the end of next week. From the high on August 8 to the pre-weekend low, the S&P 500 pulled back almost 3%. Many still seem inclined to buy the pullback they have been anticipating. However, a break of 2400 may see a loss of nerve. Of the technical indicators, the Slow Stochastics have turned higher, and the RSI looks set to do so. The MACDs are still moving lower, but are now below zero, which was where it bottomed in April. The Russell Value Index and Growth Index both fell last week for the second consecutive week. The Value Index has fallen 2.75% over the two-week period, while the Growth Index is off 1.70%. |
S&P 500 Index, August 19(see more posts on S&P 500 Index, )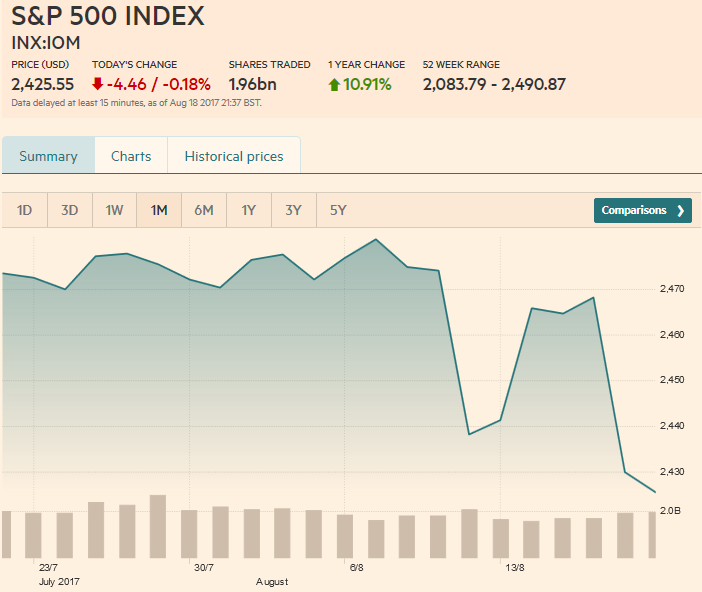 Source: markets.ft.com - Click to enlarge |
Tags: Australian Dollar,Bollinger Bands,British Pound,Canadian Dollar,Crude Oil,EUR/CHF,EUR/USD,Euro,Euro Dollar,Featured,GBP/USD,Japanese yen,MACDs Moving Average,newsletter,RSI Relative Strength,S&P 500 Index,Stochastics,Swiss Franc Index,U.S. Dollar Index,U.S. Treasuries,USD/CHF,USD/JPY

