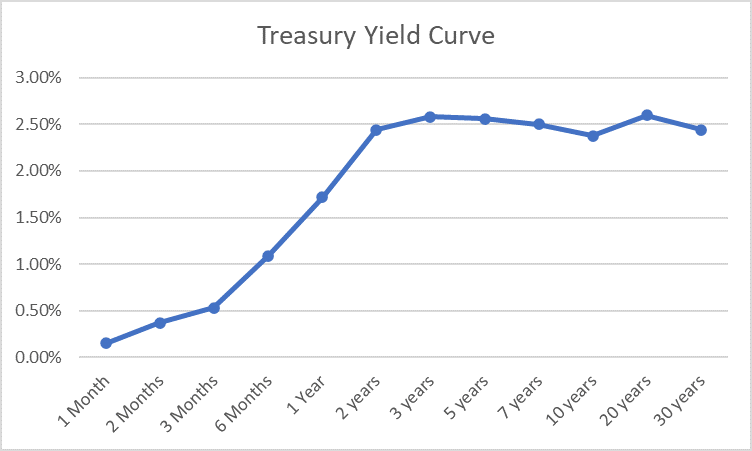
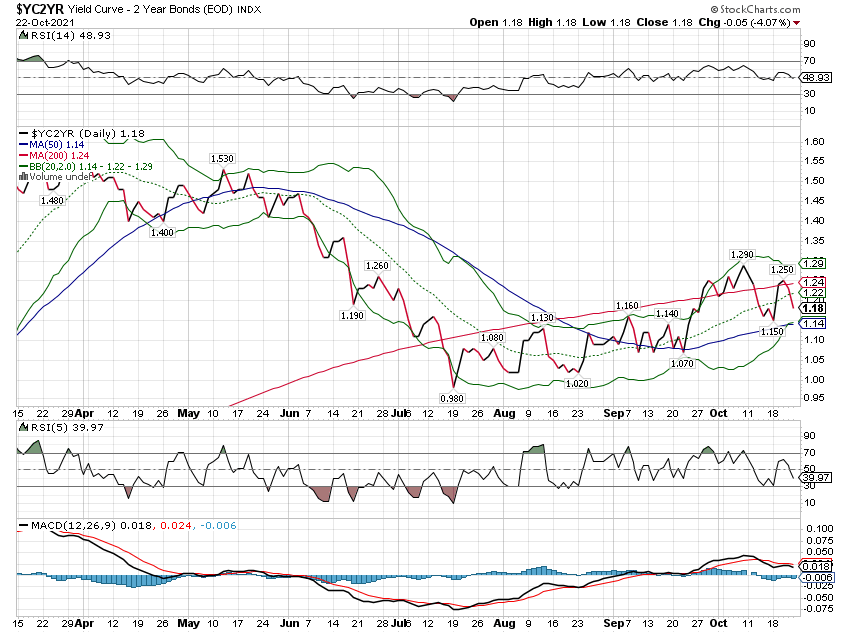
The yield curve inverted last week. Well, the part everyone watches, the 10 year/2 year Treasury yield spread, inverted, closing the week a solid 7 basis points in the negative. The difference between the 10 year and 2 year Treasury yields is not the yield curve though. The 10/2 spread is one point on the Treasury yield curve which is positively sloped from 1 month to 3 years, negatively sloped from 3 years to 10 years and positively sloped again from 10 out to 30 years: So, yes, parts of the yield curve are inverted but the short end of the curve remains fairly steep. That is an unusual situation with no recent comparable periods (back to the 1978 inversion). Typically, 10/2 inversions occur when the entire curve is flat with maturities shorter than 2 years
Topics:
Joseph Y. Calhoun considers the following as important: 5.) Alhambra Investments, Alhambra Portfolios, bonds, commodities, credit spreads, Crude Oil, currencies, Duration, Featured, Gold, Interest rates, Markets, Monetary Policy, newsletter, Real estate, Recession, stocks, unemployment rate, US dollar, Yield Curve
This could be interesting, too:
Nachrichten Ticker - www.finanzen.ch writes Die Performance der Kryptowährungen in KW 9: Das hat sich bei Bitcoin, Ether & Co. getan
Nachrichten Ticker - www.finanzen.ch writes Wer verbirgt sich hinter der Ethereum-Technologie?
Martin Hartmann writes Eine Analyse nach den Lehren von Milton Friedman
Marc Chandler writes March 2025 Monthly
| The yield curve inverted last week. Well, the part everyone watches, the 10 year/2 year Treasury yield spread, inverted, closing the week a solid 7 basis points in the negative. The difference between the 10 year and 2 year Treasury yields is not the yield curve though. The 10/2 spread is one point on the Treasury yield curve which is positively sloped from 1 month to 3 years, negatively sloped from 3 years to 10 years and positively sloped again from 10 out to 30 years:
So, yes, parts of the yield curve are inverted but the short end of the curve remains fairly steep. That is an unusual situation with no recent comparable periods (back to the 1978 inversion). Typically, 10/2 inversions occur when the entire curve is flat with maturities shorter than 2 years going on to invert later at varying frequencies. So what does the current shape of the curve mean? The Fed is a follower on rates, not a leader and if the market really believed the Fed’s hawkish rhetoric, I don’t think the front end of the curve would be this steep. Or it could just be due to a lot of uncertainty about the Fed’s path to higher rates. One thing is sure; as the nature of the economy reveals itself over the coming months, the yield curve will continue to change – at the market’s pace, not the Fed’s. Rates markets will anticipate any growth or inflation slowdown or acceleration long before it is apparent in the economic stats. |
 . |
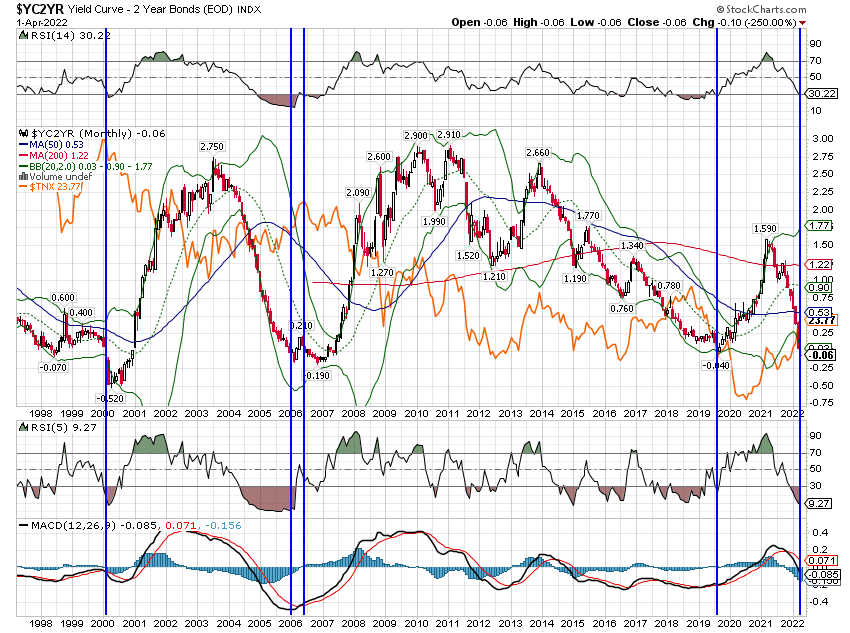
| The 10/2 term spread is important to our investment process because it has a good track record for predicting recession, having inverted prior to every recession back to the 1950s (with one false signal). So, when it inverts we do take it seriously and there are implications for our portfolios. The inversion of the 10/2 curve is an important signal for the bond portion of our portfolio but not nearly as much for the equity piece. 10/2 inversions in the past have often coincided with peaks in the 10 year Treasury yield and as such they represent opportunities to extend the duration of your bond portfolio. That doesn’t mean you should bet the farm on lower rates and buy all 30 year bonds. But if you’ve been holding short duration bonds as rates have risen – as we have – it is logical to take on some duration risk now by moving out to the intermediate part of the curve (say, 3 to 7 years).
As for stocks and other risk assets, the inversion of the 10/2 part of the curve doesn’t offer a definitive signal. The inversion is generally followed by a recession 6 months to 2 years later but there is no way to know in advance the time to the onset. Stock performance after an inversion is mixed but with a bullish bias. The 10/2 spread has inverted 6 times since 1978 (assuming at least six months since the prior inversion) and the average return 1 year later is 13.4% with 5 of the 6 periods positive (the exception was the 2000 bear market when it was down 2.53% one year later). The average return for 3 and 6 month periods are also positive (3.37% and 1.61%) but only 4 of the 6 periods were positive. |
 . |
To make a strategic change to our risk asset allocation we would need to see further evidence of imminent recession. We don’t currently have any such evidence.
When I started in this business over 30 years ago no one talked about the yield curve except the bond nerds. Most of the research on the yield curve and recession wasn’t done until the late 80s and it takes time for this stuff to filter down to the masses, even within the industry. Now, seemingly everyone knows about the yield curve, that when it inverts recession is on the way. And, predictably, we saw a plethora of articles, podcasts and tweets last week about the inversion of the curve and the fact that it signals recession. It is so well known today that there is even a Redditt about the yield curve. So, if everyone knows about the yield curve and takes action in their portfolio in anticipation of the recession it predicts, does the inversion mean the same thing it did 30 years ago? Since everyone knows that everyone knows about the yield curve, is it possible that some took actions in anticipation of an inversion and by doing so actually caused it? I don’t know but I learned a long time ago that there are no sure things in this business. And that things that are well known are probably not the things you should be focused on – they’re already in the market. In my 30 years in this business and 40 years as an investor, I have seen many things happen that weren’t “supposed” to happen and a few things happen that we thought were impossible. Could the yield curve be wrong this time? I wouldn’t bet on it but the fact that it has become so well known does give me pause.
Having said that, I will not dismiss this inversion as nothing. The track record of the 10/2 yield curve is strong and cannot be ignored. So, acknowledge it, respect it and take actions that are backed by historical evidence. History says that the inversion is a good time to take on some duration risk in the bond portion of your portfolio but realize there isn’t a lot of data to base that on. Don’t take it as gospel and make a big bet on long term bonds. History also says this isn’t a time to upset the risk side of your portfolio until more evidence about the economy points to recession. For instance, we would expect to see credit spreads widen prior to recession and so far that just hasn’t happened to any significant degree. Spreads widened briefly but not to anywhere near the levels associated with recession or stock bear markets. And they have since narrowed.
The inversion of part of the yield curve is a warning but it is only a possible first step to recession. Don’t assume you know how the next steps will proceed and at what pace. Even assuming the 10/2 term spread retains its predictive value (and it probably will), it tells you nothing about how we get from here to recession. The journey promises to hold a lot of surprises.
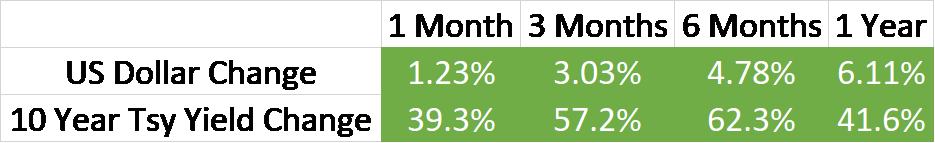
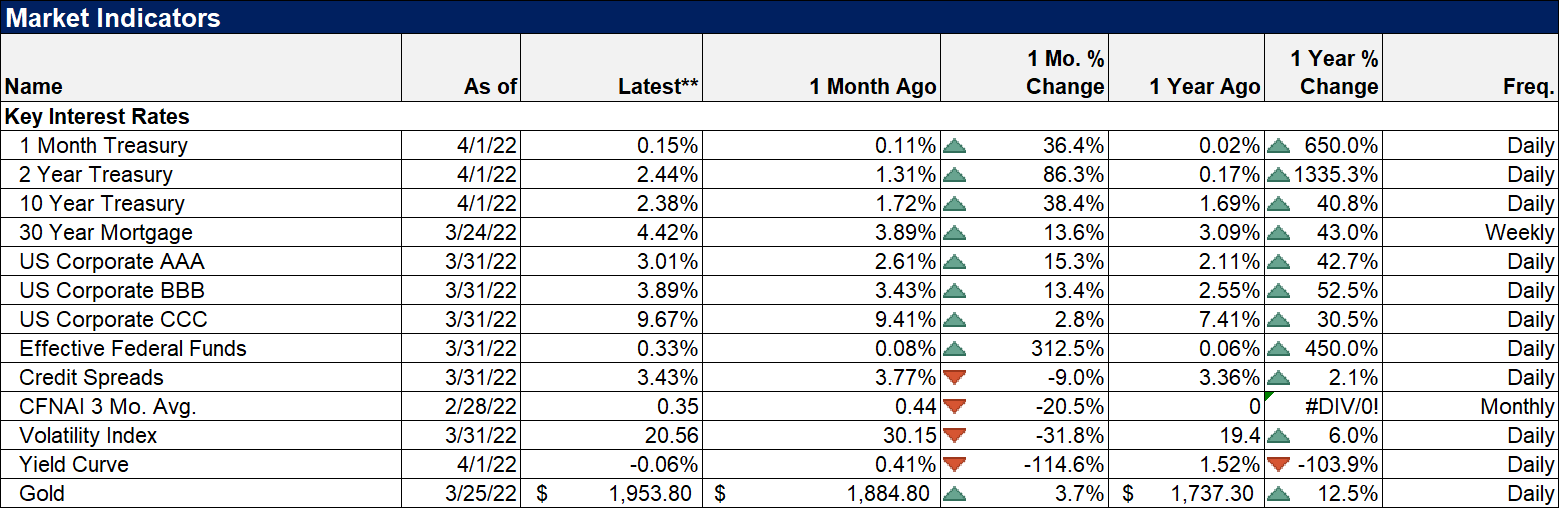
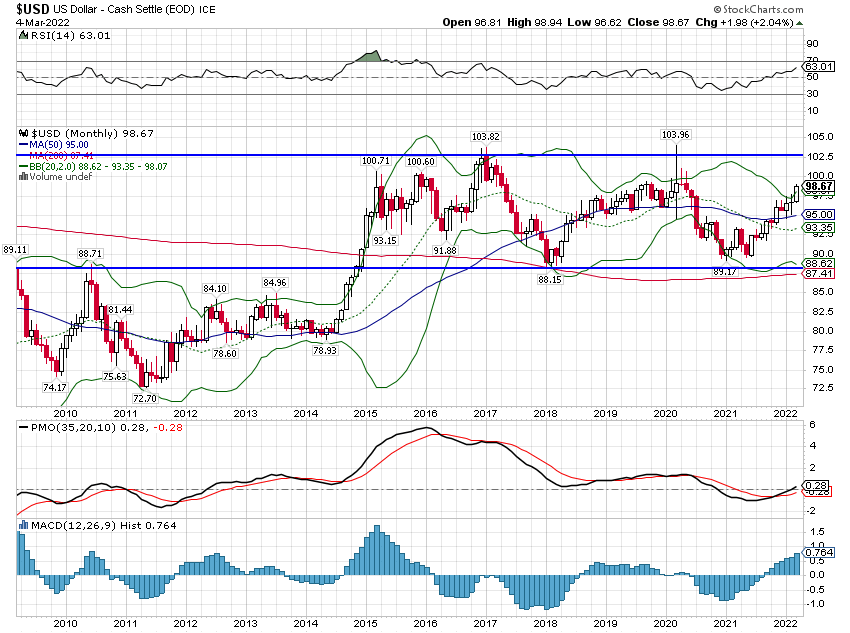
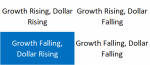
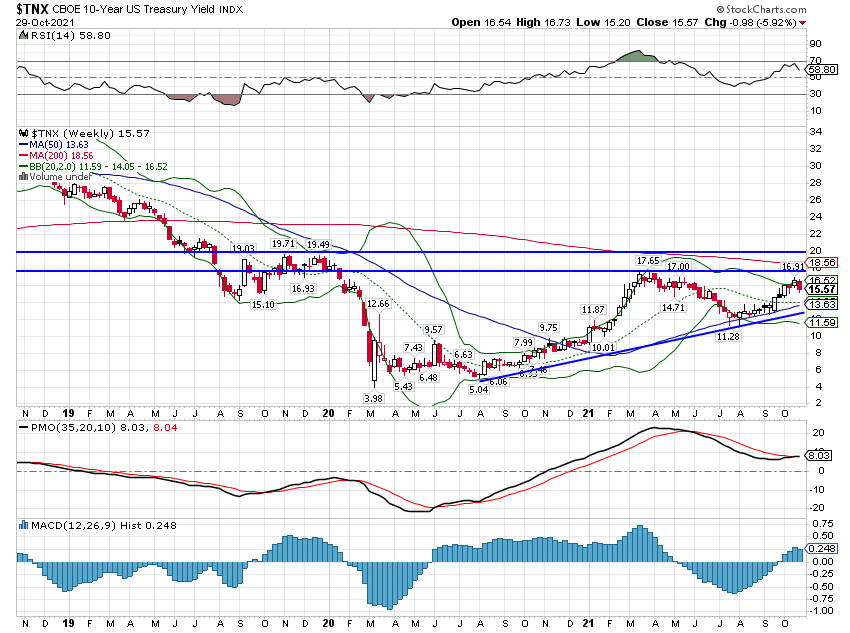
EnvironmentOur rising rate, rising dollar environment continues. The dollar is still near the top of its long term range and I don’t see anything that is about to change that in the near term. Given what is going on in the world right now, the wonder is that it isn’t higher. The rate on the 10 year Treasury fell about 12 basis points last week but it is still up considerably since the beginning of the year. I am expecting a bond rally (rates falling) in the near term but the long term trend is still up. |
 . |
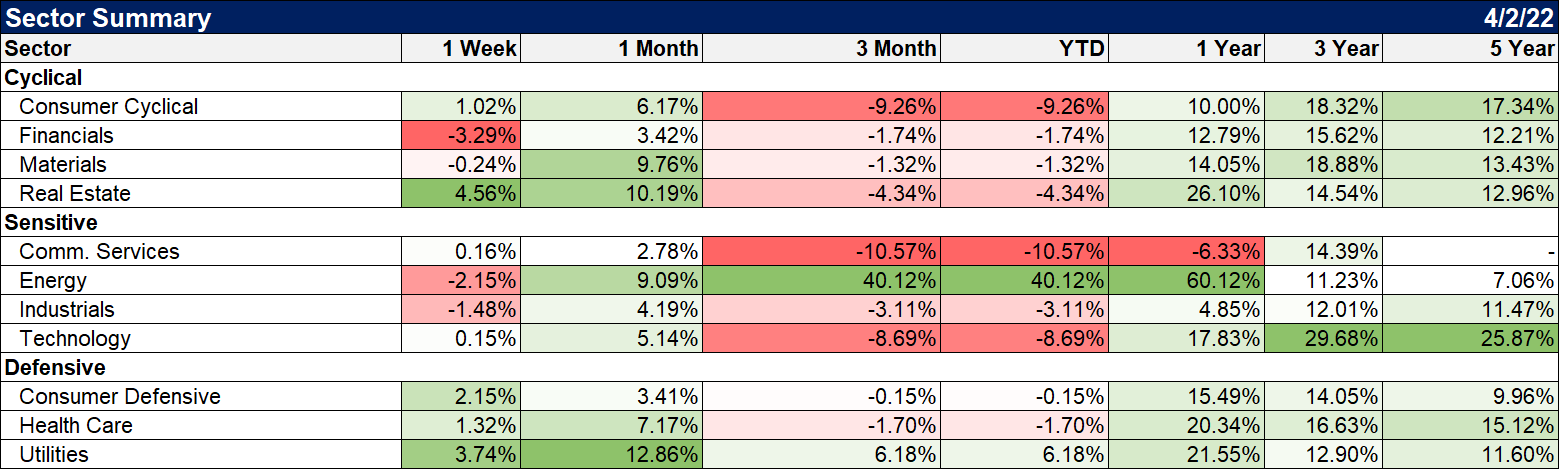
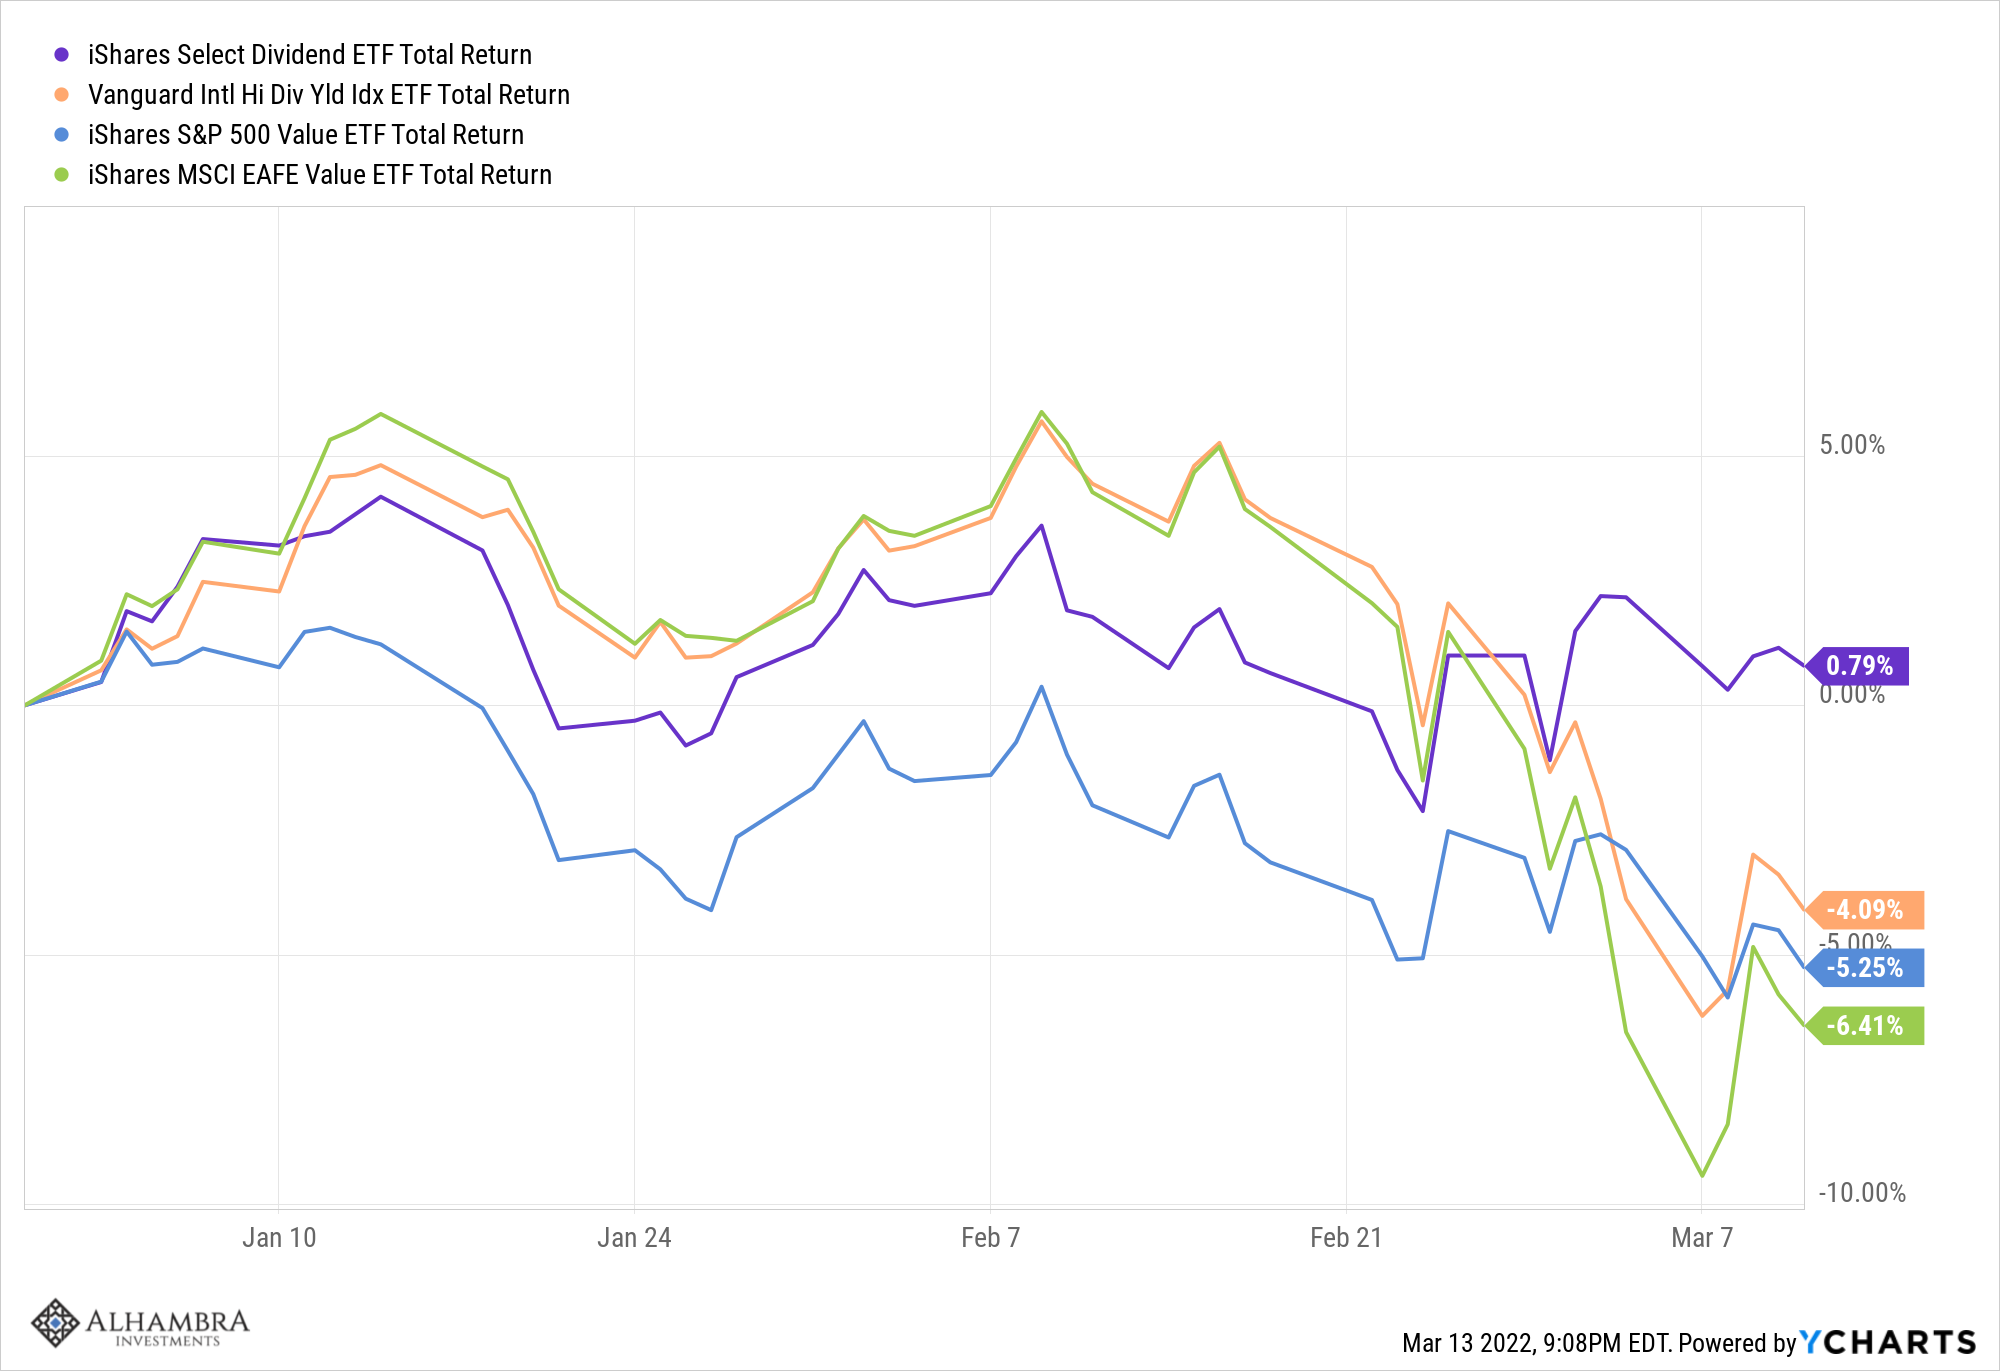
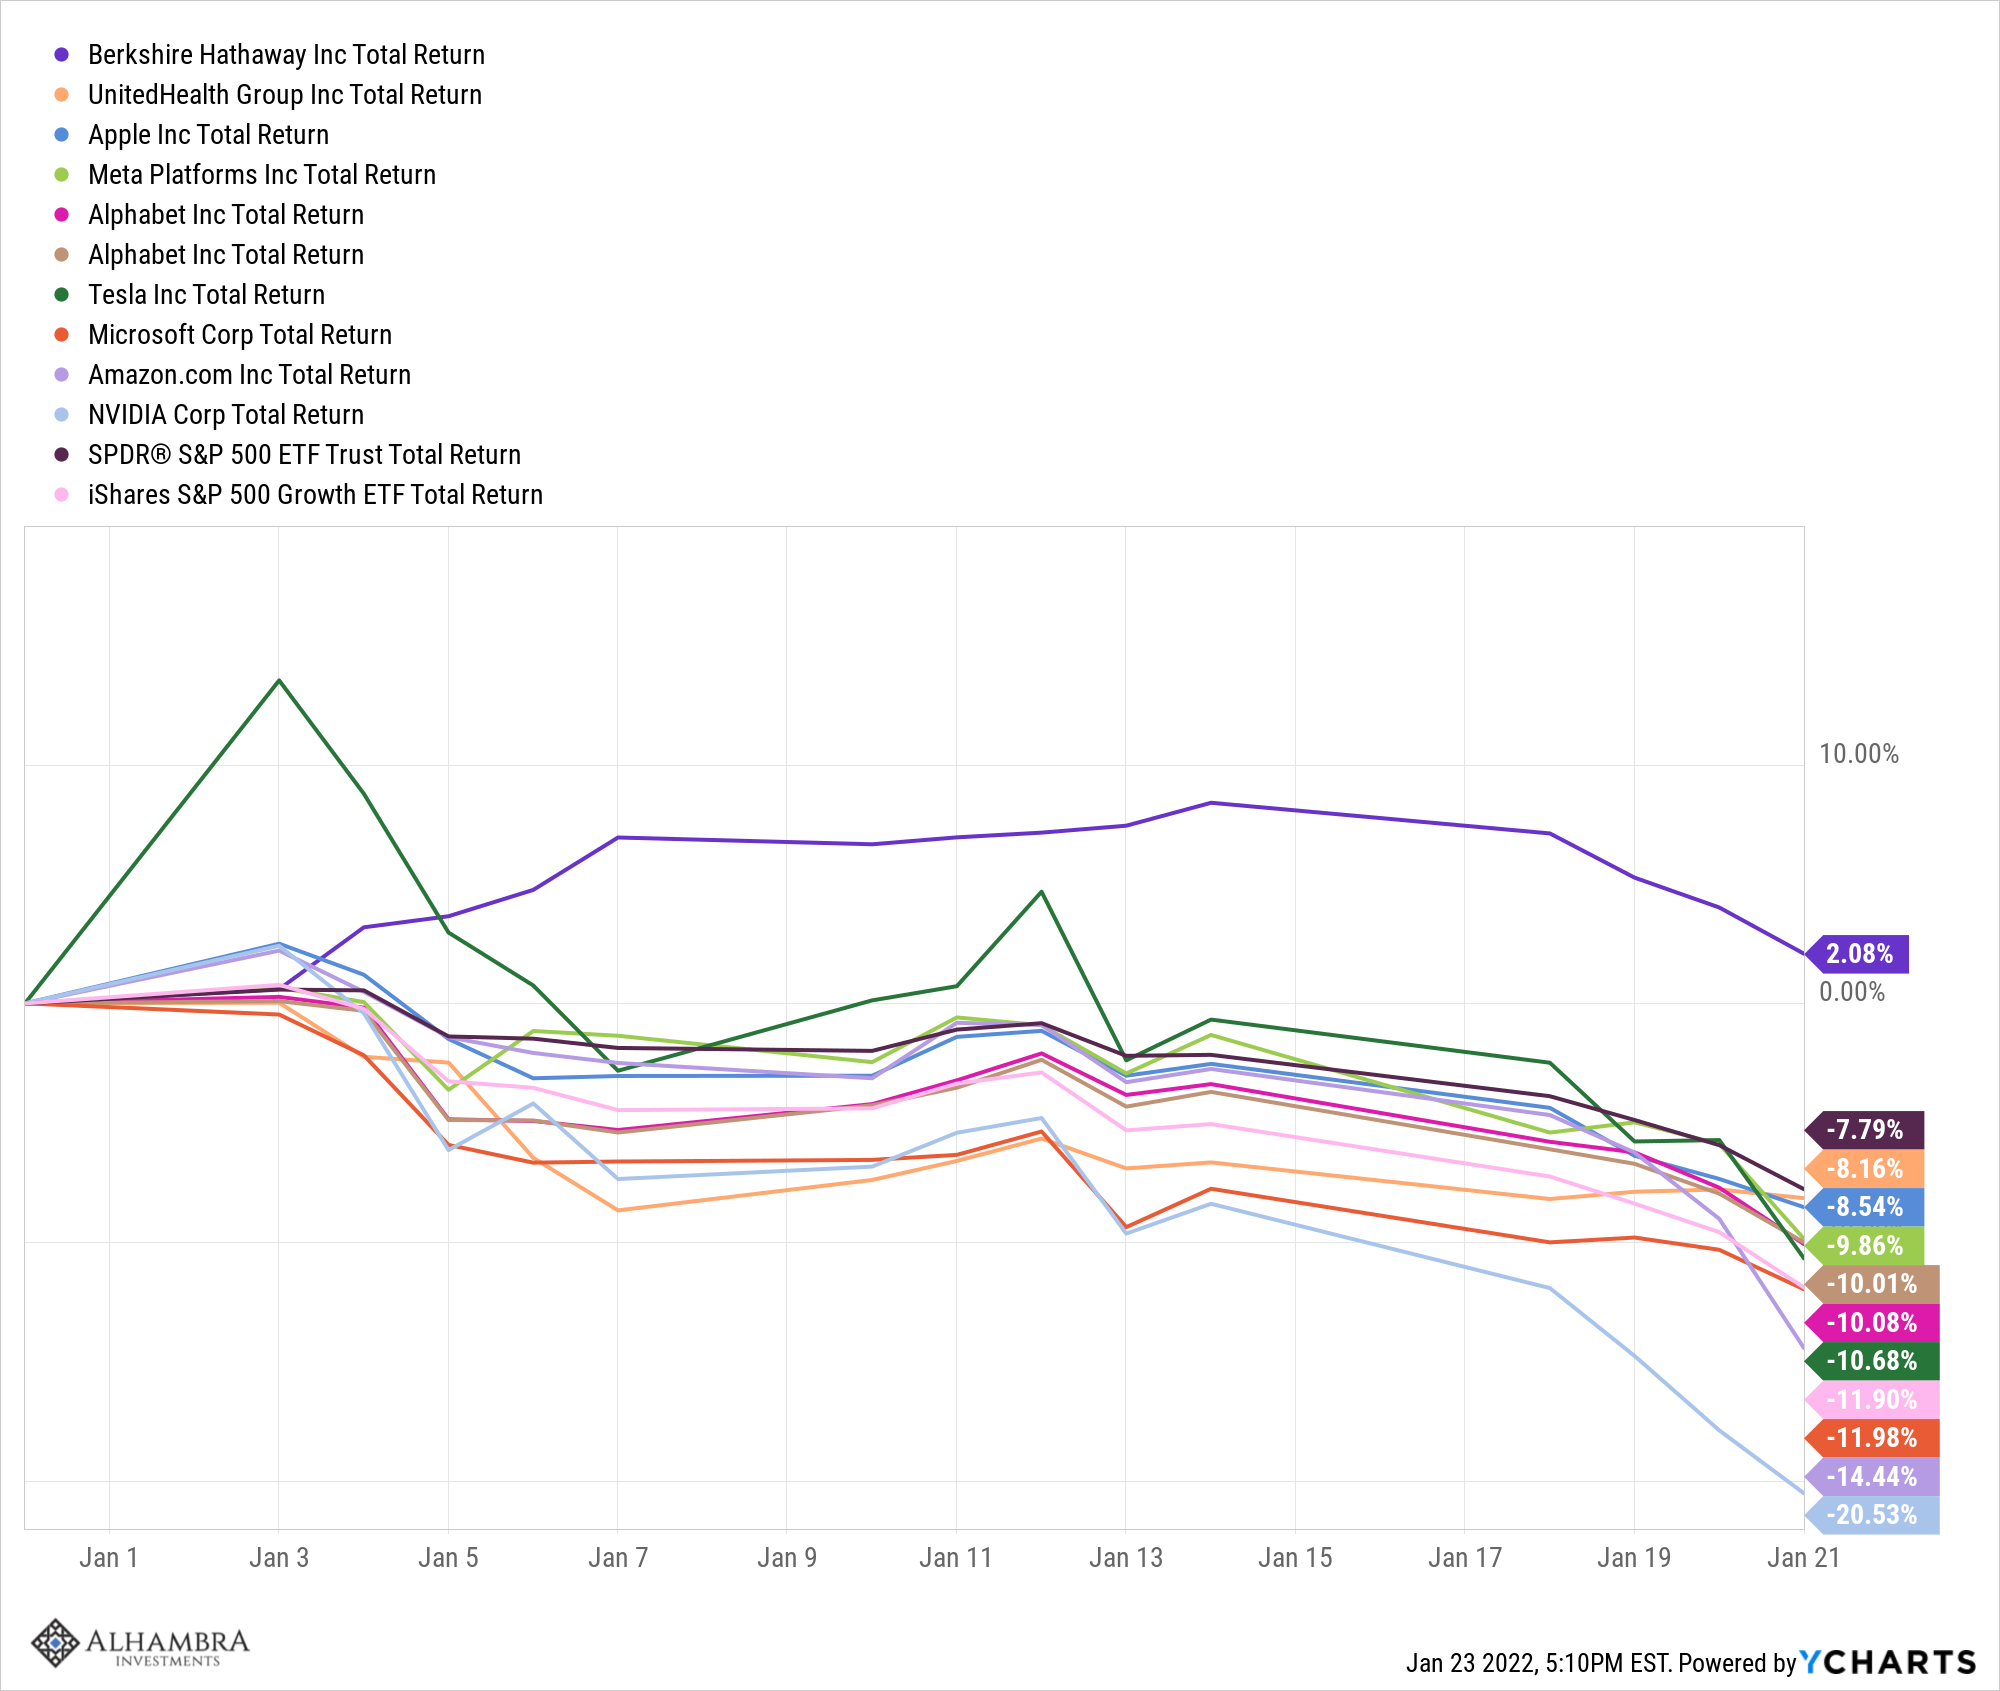
Markets ReviewStocks squeaked out a gain last week but all major equity categories closed the quarter with a loss. Bonds, as discussed last week, have had one of their worst starts to a year ever. The aggregate bond index finished the quarter down over 6%. Commodities were down last week as crude oil closed under $100 but are still the runaway winners for the year to date, one year and three year returns. US stocks were down but still did better than most other regions of the world. US stocks are also about the last market with a positive sign on its one year return. Growth outperformed last week but value has dramatically outperformed year to date. |
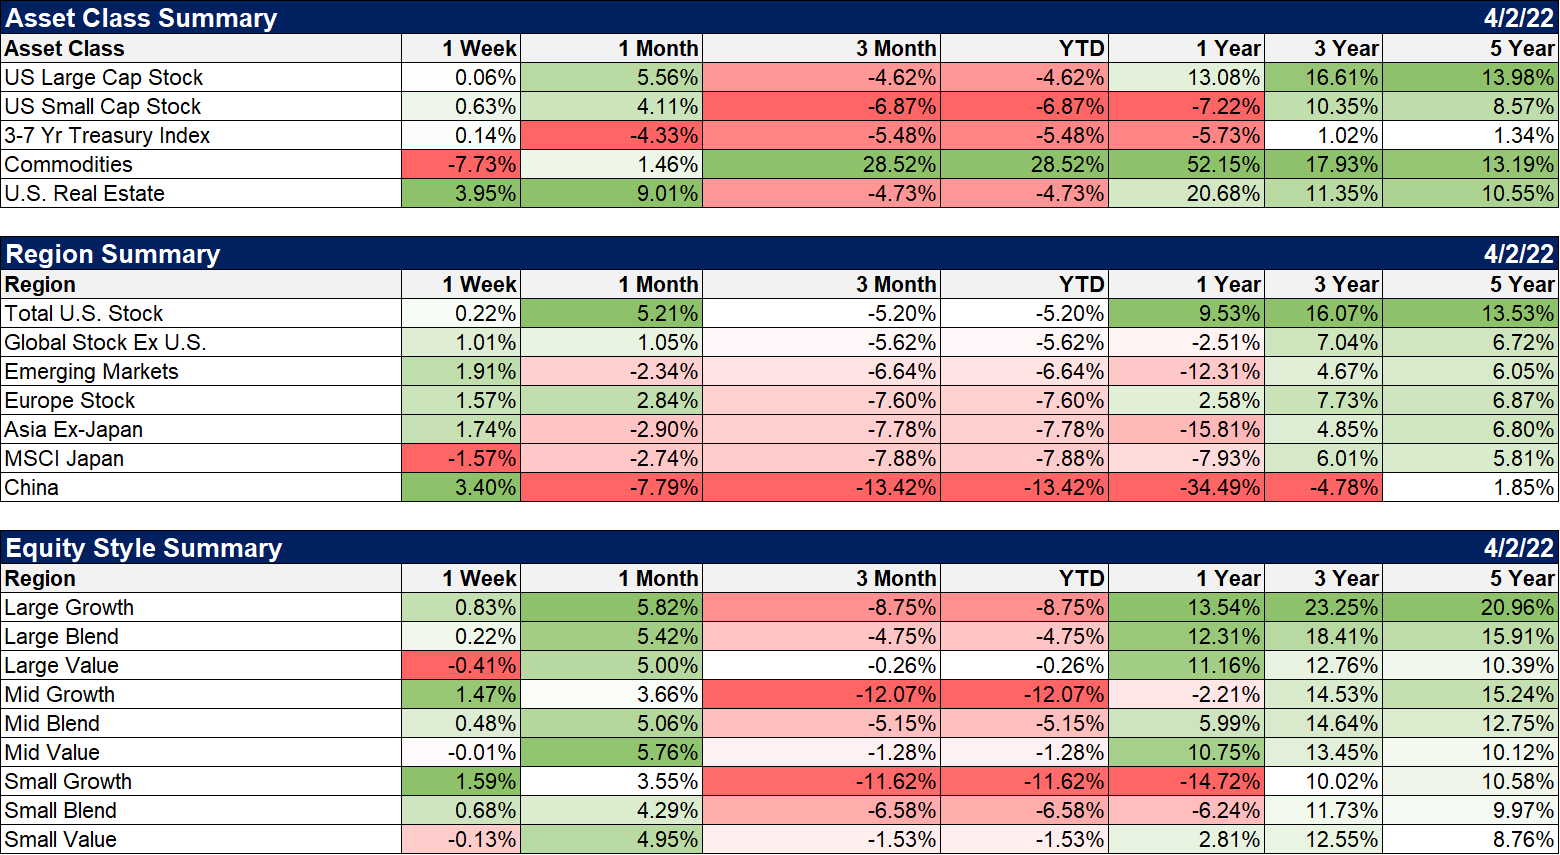 . |
| Financials took a hit last week with the yield curve inverting despite zero evidence that the inversion affects banks margins. Real estate was a winner with the slight fall in rates as were utilities. |
 . |
| I don’t know when the next recession will arrive and I don’t know if the yield curve inversion last week will prove a timely signal for investors. What I do know is that economies and markets move in cycles (that are never in sync) and that when things are at extreme you should expect a reversal. When everything looks great when you ought to start worrying. And while there are problems with our economy there are some metrics that are probably about as good as they can get. Jobless claims running at levels last seen in the 1960s probably aren’t going to get a lot better from here. The unemployment rate hit 3.5% in September of 2019 and last week fell to 3.6%. The only times it has been lower were in the late 1960s and the early 1950s. It probably won’t get a lot better from here. That doesn’t mean the economy can’t improve – I sure hope it can – but if it does it will be in ways that are more subtle. |
 . |
One last note about sentiment on the economy and the markets. The drop in the U of Michigan consumer sentiment survey over the last 12 months is one of the largest ever. The current level of the index is below levels associated with recession in the past. And yet we do not appear to be in recession at the moment. So maybe that is coming or it’s already here and we just don’t recognize it (possible but I don’t think so). But here’s the thing; these big drops in consumer sentiment have, in the past, been great buying opportunities. Stock market returns are higher after these big drops than other times with more positive sentiment. I don’t think stock market sentiment ever reached a real negative extreme in the recent correction so there may be more work to do on the downside but I’d be wary of getting too negative. Consumer sentiment is a contrarian indicator. By the way, inflation expectations within the U of M survey are negatively correlated with subsequent inflation rates. And those expectations are at their highest since May of 2008 when oil was just about to hit its all time high over $140. Betting on more inflation right now is the consensus.
Don’t over react to the yield curve warning. It is just a warning and we don’t have nearly enough evidence yet to make big changes to our portfolios. Patience is, as always, a virtue.
Joe Calhoun
You Might Also Like
 Weekly Market Pulse: The Cure For High Prices
2022-03-31
There’s an old Wall Street maxim that the cure for high commodity prices is high commodity prices. As prices rise two things will generally limit the scope of the increase. Demand will wane as consumers just use less or find substitutes. Supply will also increase as the companies that extract these raw materials open new mines, grow more crops or drill new wells.
 Weekly Market Pulse: Is This A Bear Market?
2022-03-16
I don’t know the answer to the question posed in the title. No one does because the future is not predictable. I don’t know what will happen in Ukraine. I don’t know how much what has already happened there – and what might – matters to the US and global economy. I don’t know if the Fed is making a mistake by (likely) hiking interest rates by an entire 1/4 of 1% this week.
 Weekly Market Pulse: Oil Shock
2022-03-08
Crude oil prices rose over 25% last week and as I sit down to write this evening the overnight futures are up another 8% to around $125. Almost every other commodity on the planet rose in prices last week too, as did the dollar. Those two factors – rising dollar and rising commodity prices – mean the likelihood of recession in the coming year has risen significantly in just the last week.
 Weekly Market Pulse: Are We There Yet?
2022-01-31
I’ll just get this out of the way right at the beginning. The question in the title of this post refers to the end of the ongoing stock market correction and the answer is likely no. There are no sure things in this business so it isn’t an unequivocal no, but based on history, the odds favor more weakness.
 Weekly Market Pulse: Fear Makes A Comeback
2022-01-24
Fear tends to manifest itself much more quickly than greed, so volatile markets tend to be on the downside. In up markets, volatility tends to gradually decline.
 Weekly Market Pulse: Discounting The Future
2021-12-07
The economic news recently has been better than expected and in most cases just pretty darn good. That isn’t true on a global basis as Europe continues to experience a pretty sluggish recovery from COVID. And China is busy shooting itself in the foot as Xi pursues the re-Maoing of Chinese society, damn the economic costs.
 Weekly Market Pulse: Growth Scare?
2021-11-01
A couple of weeks ago the 10 year Treasury note yield rose 16 basis points in the course of 5 trading days. That move was driven by near term inflation fears as I discussed last week. Long term inflation expectations were and are well behaved.
 Weekly Market Pulse: Inflation Scare!
2021-10-25
The S&P 500 and Dow Jones Industrial stock averages made new all time highs last week as bonds sold off, the 10 year Treasury note yield briefly breaking above 1.7% before a pretty good sized rally Friday brought the yield back to 1.65%. And thus we’re right back where we were at the end of March when the 10 year yield hit its high for the year.
Tags: Alhambra Portfolios,Bonds,commodities,credit spreads,Crude Oil,currencies,Duration,Featured,Gold,Interest rates,Markets,Monetary Policy,newsletter,Real Estate,recession,stocks,unemployment rate,US dollar,Yield Curve