The Federal Reserve didn’t just raise the range for its federal funds target by 25 bps, upper and lower bounds, it also added the same to its twin policy tools which the “central bank” says are crucial to maintaining order in money markets thereby keeping federal funds inside the band where it is supposed to be. The FOMC voted to increase IOER from 15 bps to 40 bps, and the RRP from 5 bps to 30 bps. That RRP, or reverse repo program, is meant to be something of a soft floor, when for its history it has been so soft, in particular where T-bills are included, it can scarcely be considered a “floor.” Why would anyone buy a short run Treasury bill yielding anything less than RRP when they could instead “lend” the same cash to the Federal Reserve at a higher rate
Topics:
Jeffrey P. Snider considers the following as important: 5.) Alhambra Investments, bonds, Collateral, collateral scarcity, collateral shortage, currencies, Deflation, economy, Featured, Federal funds, Federal Reserve/Monetary Policy, ioer, Markets, newsletter, rate hikes, Repo, rrp, T-Bills, U.S. Treasuries
This could be interesting, too:
Nachrichten Ticker - www.finanzen.ch writes Die Performance der Kryptowährungen in KW 9: Das hat sich bei Bitcoin, Ether & Co. getan
Nachrichten Ticker - www.finanzen.ch writes Wer verbirgt sich hinter der Ethereum-Technologie?
Martin Hartmann writes Eine Analyse nach den Lehren von Milton Friedman
Marc Chandler writes March 2025 Monthly
The Federal Reserve didn’t just raise the range for its federal funds target by 25 bps, upper and lower bounds, it also added the same to its twin policy tools which the “central bank” says are crucial to maintaining order in money markets thereby keeping federal funds inside the band where it is supposed to be. The FOMC voted to increase IOER from 15 bps to 40 bps, and the RRP from 5 bps to 30 bps.
That RRP, or reverse repo program, is meant to be something of a soft floor, when for its history it has been so soft, in particular where T-bills are included, it can scarcely be considered a “floor.” Why would anyone buy a short run Treasury bill yielding anything less than RRP when they could instead “lend” the same cash to the Federal Reserve at a higher rate collateralized by a Treasury security anyway?
Yet, this happens with startling frequency.
There can only be premium value in T-bills above and beyond these investment considerations. Any bill’s equivalent which finds itself below RRP is a direct indication of that other value.
Collateral.
When rates were down at the zero lower bound, it was nearly impossible for nominal T-bill rates to help us identify collateral scarcity because, outside of the most extreme cases (like 2008 and 2011), they weren’t going to go negative to get below RRP. And if they had gone below zero, we wouldn’t really need the RRP rate comparison since a negative T-bill rate would have been more than enough on its own.
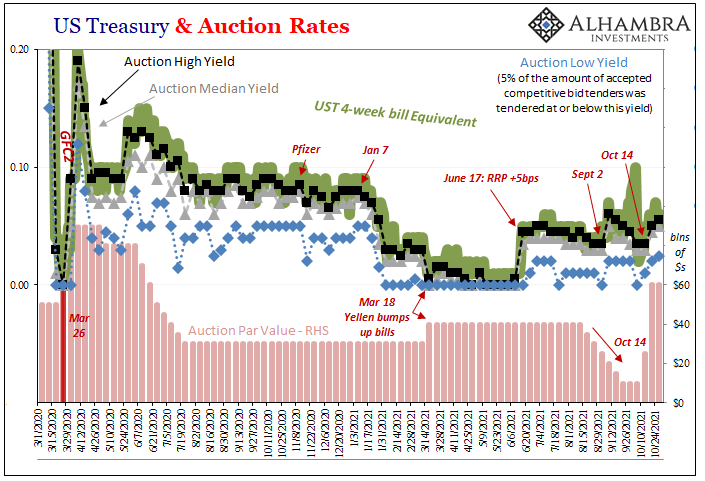
On June 17, however, the Fed raised the RRP off the zero lower bound, adding 5 bps because of that whole “too much money” nonsense. And when the FOMC did, they did us a huge favor because of what happened straight away. As I wrote that day:
Having raised particularly the RRP to now 5 bps effective today, however, first the Fed enticed even more participants to its window – as anyone would’ve expected. Pay more, see more activity. According to FRBNY, this afternoon’s RRP total was an astounding $755.8 billion from now 68 counterparties, up from $520.9 billion just yesterday. That’s not the important part, either. Having raised the policy “floor”, Jay Powell and his group have unwittingly shown the market hand: collateral, not “abundant reserves.”
With the RRP at five, T-bill rates then had a five bp spread above zero thereby creating their own range from which to show us the collateral strain without needing to go negative to do it.
Sure enough, first day of the new RRP, it was the 8-week and 3-month bills which came in at four – each a bip less than what “should” have been a more solid floor. Pillow soft, instead.
For the rest of last year up to the end of February this year, despite debt ceiling drama creating volatility in the bills along the way, the front issues (from 4w to 3m) took turns plunging underneath RRP and sticking around in the depths for days on end.
All week, we’ve been making what I believe is an airtight collateral case, meaning an overwhelming mountain of evidence all pointing to scarcity if not shortage. And then this week along comes the Fed to “help” us out even more. The first day for the 30 bps RRP, yesterday, and the 4-week bill prices at…20 bps. That’s a full ten-spot less and an unmistakable (if you’re not captured by the Fed and the financial media) collateral signal, the biggest one yet. |
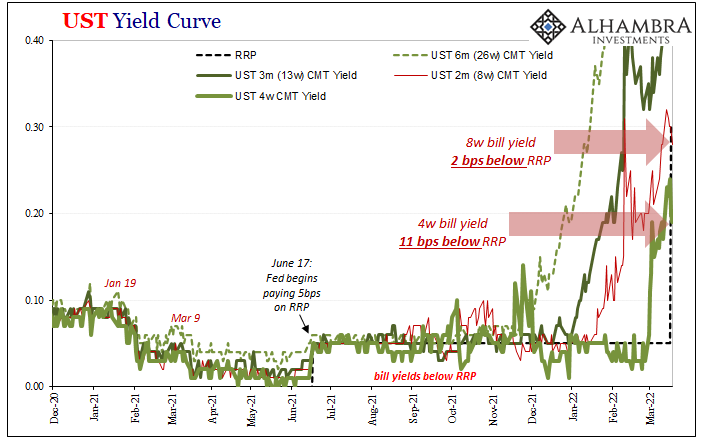 |
| It has been followed up today where the 4-week bill yield actually declined another bip, down to 19, and now joined by the 8-week instrument which closed at 28 bps, two below. With so much being currently and quite easily displayed about collateral scarcity, perhaps even shortage, the only thing missing along those lines is one of our “collateral days.”Or is it?
Before getting to that, we’ve been on the lookout for one of these since last summer simply because in the past it has been a dependable signal of substantial deterioration (or escalation, depending upon your perspective). On that topic last July:
|
 |
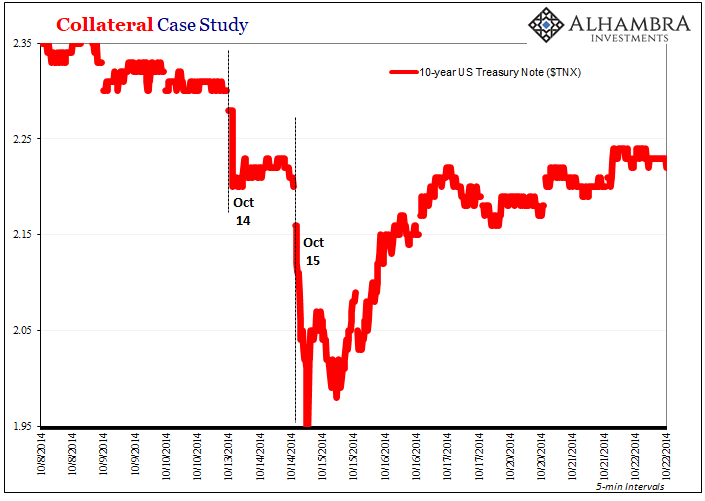
| That’s what we could observe on May 29, 2018, just as we had way back on October 15, 2014.
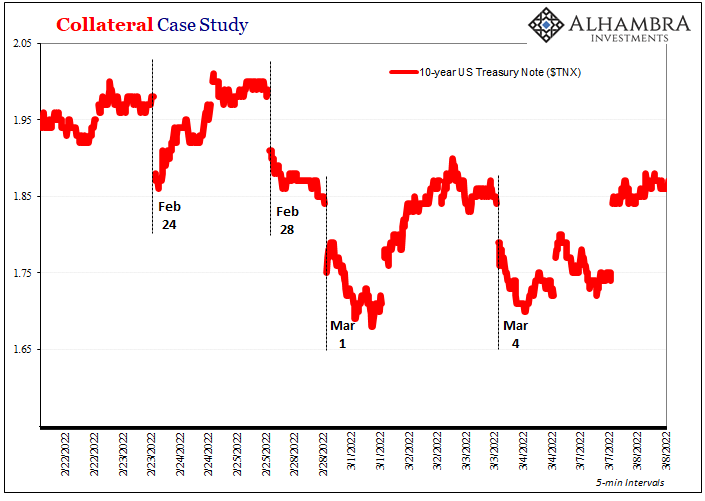
There is a very good chance we already experienced something similar, close to what happened on May 29 or October 15. And this was just a few weeks ago, preceding all the big(ger) curve moves. Perhaps instead it of a single collateral day, this time it was a series of days – two in particular. Lost in the oil-y noise of Russia/Ukraine, back on February 24, there was the first rumble. Then again on February 28 followed by March 1. The process was actually repeated onc more on March 4. Might any of these count as a May 29, another October 15? Actually, May 29 was itself built up by a series. On May 23, 2018, and again May 25 (the Friday before Memorial Day holiday), “flight to safety” was evident across global markets (not just USTs), which in these instances really just means scramble for collateral particularly in the early morning hours when yesterday’s repos are being unwound and leveraged funding participants are trying to stay ahead – literally – of the collateral calls and curves. |
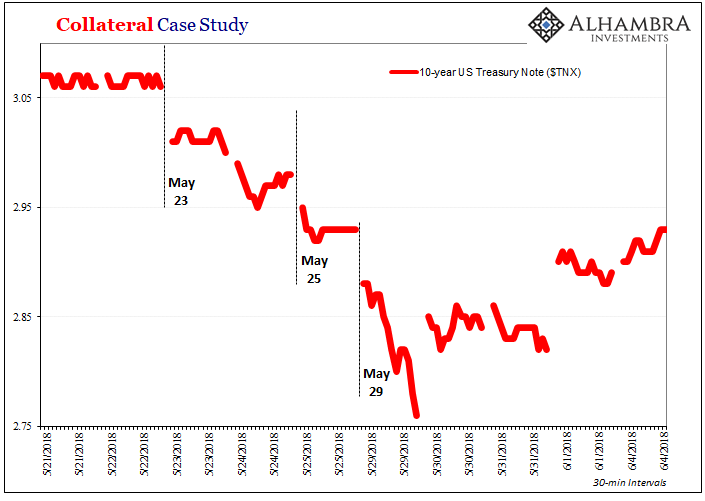 |
| From the close on May 22 to the bottom of May 29, the 10-year dropped a sudden (and unsettling, for media watchers expecting only “interest rates have nowhere to go but up” given how hawkish Jay Powell’s Fed had become at the time) 31 bps.
You’ll note that on February 28 and March 1, to the low on March 1, the 10-year declined by roughly…31 bps. Most of the damage done in the early hours spilling over into the morning (US time) session(s). The only real difference between these and October 15, 2014, is their scale; that one was, well, just huge (and ridiculously blamed on computer trading errors). Seven and a half years later, the public remains in the dark, an atrocious bit of mainstream corruption, especially given how history unfolded (it sure wasn’t overheating and inflation). |
 |
| We’re focusing on the 10-year benchmark Treasury yield because of the two factors that may have sent them sharply downward: first, a direct collateral premium, meaning a scramble to buy especially the on-the-runs to be used in repo for the likely contraction in the collateral multiplier herding the market into the most liquid and pristine formats; second, the longer run deflationary potential which definitely depresses rates (starkly less growth and inflation potential) given near-term and intermediate-term implications such a very clear break in collateralized operations represented by such days, or series of days.
With what happened a few weeks ago, our collateral case for curve inversions made stronger, ironically, by the Fed. Not as some absurd “policy error” excuse, but in setting RRP further away from zero we get a wider range for T-bills to demonstrate just how much of deflationary potential from collateral scarcity there must be right now as I write this. Now that the yield curve has joined eurodollar futures being inverted, maybe it wasn’t one collateral day, but then again prior collateral days weren’t really, either. I believe we can check this one off our growing list of escalating warnings, too. |
 |
Tags: Bonds,collateral,collateral scarcity,collateral shortage,currencies,Deflation,economy,Featured,federal funds,Federal Reserve/Monetary Policy,ioer,Markets,newsletter,rate hikes,repo,rrp,T-Bills,U.S. Treasuries


