Overview: Today may be the calm ahead of a tomorrow's US CPI and rate decisions by the Fed, ECB, BOJ, and PBOC over the next few days. Most large bourses in the Asia Pacific region rose and Europe's Stoxx 600 is snapping a three-day decline. US index futures are trading higher. US 10-year yield is slightly firmer as are core European benchmark yields. The dollar is under broad pressure and is weaker against the G10 currencies. Against emerging market currencies, it...
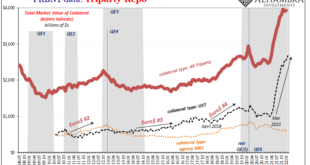
Read More »Collateral Shortage…From *A* Fed Perspective
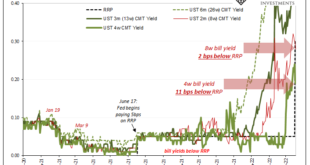
It’s never just one thing or another. Take, for example, collateral scarcity. By itself, it’s already a problem but it may not be enough to bring the whole system to reverse. A good illustration would be 2017. Throughout that whole year, T-bill rates (4-week, in particular) kept indicating this very shortfall, especially the repeated instances when equivalent bill yields would go below the RRP “floor” and often stay there for prolonged periods. There was, as I wrote...
Read More »What Really ‘Raises’ The Rising ‘Dollar’
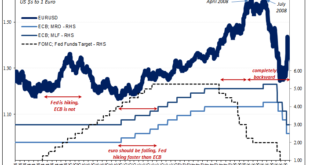
It’s one of those things which everyone just accepts because everyone says it must be true. If the US$ is rising, what else other than the Federal Reserve. In particular, the Fed has to be raising rates in relation to other central banks; interest rate differentials. A relatively more “hawkish” US policy therefore the wind in the sails of a “strong” dollar exchange regime. How else would we explain, for example, the euro’s absolute plunge since around May last year?...
Read More »Yield Curve Inversion Was/Is Absolutely All About Collateral
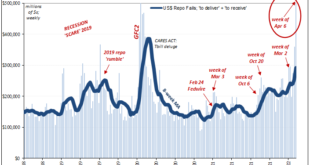
If there was a compelling collateral case for bending the Treasury yield curve toward inversion beginning last October, what follows is the update for the twist itself. As collateral scarcity became shortage then a pretty substantial run, that was the very moment yield curve flattening became inverted. Just like October, you can actually see it all unfold. According to the latest FRBNY data taken from Primary Dealers, repo fails during the week of April 6 (most...
Read More »The Fed Inadvertently Adds To Our Ironclad Collateral Case Which Does Seem To Have Already Included A ‘Collateral Day’ (or days)
The Federal Reserve didn’t just raise the range for its federal funds target by 25 bps, upper and lower bounds, it also added the same to its twin policy tools which the “central bank” says are crucial to maintaining order in money markets thereby keeping federal funds inside the band where it is supposed to be. The FOMC voted to increase IOER from 15 bps to 40 bps, and the RRP from 5 bps to 30 bps. That RRP, or reverse repo program, is meant to be something of a...
Read More »There Is An Absolutely Solid Collateral Case For What’s Driving Curve Inversion(s) [Part 2]
Securities lending as standard practice is incredibly complicated, and for many the process can be counterintuitive. With numerous different players contributing various pieces across a wide array of financial possibilities, not to mention the whole expanse of global geography, collateral for collateral swaps have gone largely unnoticed by even mainstream Economics and central banking. This despite the fact, yes, fact, securities lending was the epicenter of the 2008...
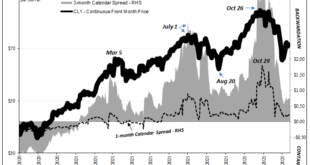
Read More »Playing Dominoes
That was fast. Just yesterday I said watch out for when the oil curve flips from backwardation to contango. When it does, that’s not a good sign. Generally speaking, it means something has changed with regard to future expectations, at least one of demand, supply, or also money/liquidity. Contango is a projected imbalance which leaves the global system facing realistic prospects of being overwhelmed with too much oil. Back during 2014’s crude crash, Economists and...
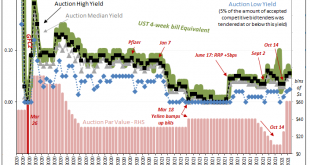
Read More »Bill Issuance Has Absolutely Surged, So Why *Haven’t* Yields, Reflation, And Other Good Things?
Treasury Secretary Janet Yellen hasn’t just been busy hawking cash management bills, her department has also been filling back up with the usual stuff, too. Regular T-bills. Going back to October 14, at the same time the CMB’s have been revived, so, too, have the 4-week and 13-week (3-month). Not the 8-week, though. Of the first, it’s been a real tsunami at this tenor, too. Up to early August, Treasury had regularly (weekly) sold $40 billion in one-month paper. From...
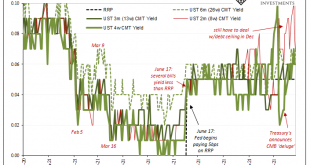
Read More »Short Run TIPS, LT Flat, Basically Awful Real(ity)
Over the past week and a half, Treasury has rolled out the CMB’s (cash management bills; like Treasury bills, special issues not otherwise part of the regular debt rotation) one after another: $60 billion 40-day on the 19th; $60 billion 27-day on the 20th; and $40 billion 48-day just yesterday. Treasury also snuck $60 billion of 39-day CMB’s into the market on the 14th to go along with the two scheduled 119-day CMB’s during this period. That’s a quick $220 billion...
Read More »The Curve Is Missing Something Big
What would it look like if the Treasury market was forced into a cross between 2013 and 2018? I think it might be something like late 2021. Before getting to that, however, we have to get through the business of decoding the yield curve since Economics and the financial media have done such a thorough job of getting it entirely wrong (see: Greenspan below). And before we can even do that, some recent housekeeping at the front of the curve where bill lives. Treasury...
Read More » Swiss Economicblogs.org


