There were a few surprises included in the BLS JOLTS data just released today for the month of November (note: the government has changed its release schedule so that JOLTS, already one month further in arrears than the payroll report, CES & CPS, will now come out earlier so that its numbers are publicly available for the same monthly payrolls before the next CES & CPS get released). Not really about the JOLTS figures themselves, though there are implications about them to consider. Instead, the net turnover which we kind of use to reconcile JOLTS with CES has been diverging of late, with a rather large discrepancy now penciled in for November 2021. . Just what the FOMC needs in time for double taper, more ambiguity in the labor data (yesterday we examined the
Topics:
Jeffrey P. Snider considers the following as important: 5.) Alhambra Investments, currencies, economy, establishment survey, Featured, Federal Reserve/Monetary Policy, hires, job openings, jolts, Labor market, layoffs, Markets, net turnover, newsletter, quits
This could be interesting, too:
Nachrichten Ticker - www.finanzen.ch writes Die Performance der Kryptowährungen in KW 9: Das hat sich bei Bitcoin, Ether & Co. getan
Nachrichten Ticker - www.finanzen.ch writes Wer verbirgt sich hinter der Ethereum-Technologie?
Martin Hartmann writes Eine Analyse nach den Lehren von Milton Friedman
Marc Chandler writes March 2025 Monthly
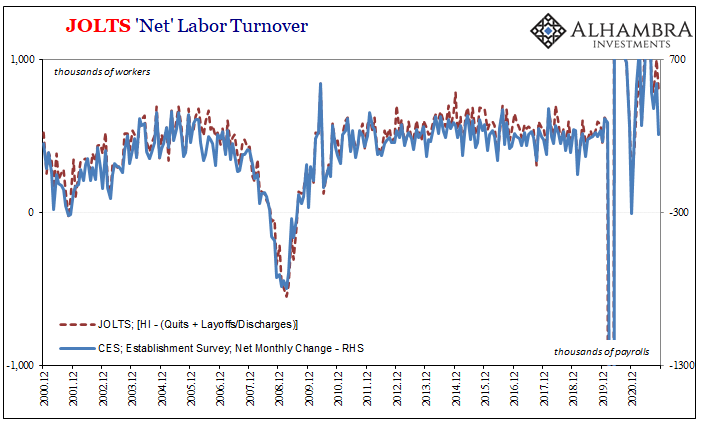
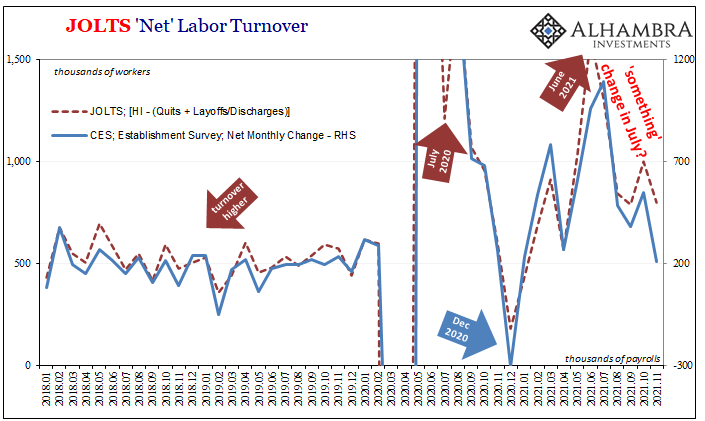
| There were a few surprises included in the BLS JOLTS data just released today for the month of November (note: the government has changed its release schedule so that JOLTS, already one month further in arrears than the payroll report, CES & CPS, will now come out earlier so that its numbers are publicly available for the same monthly payrolls before the next CES & CPS get released). Not really about the JOLTS figures themselves, though there are implications about them to consider.
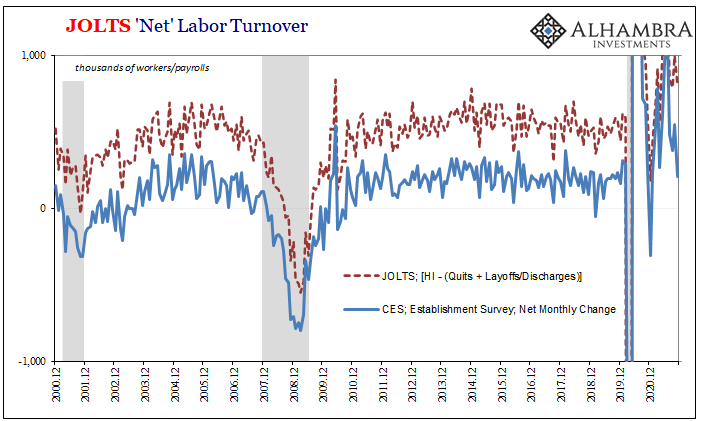
Instead, the net turnover which we kind of use to reconcile JOLTS with CES has been diverging of late, with a rather large discrepancy now penciled in for November 2021. |
|
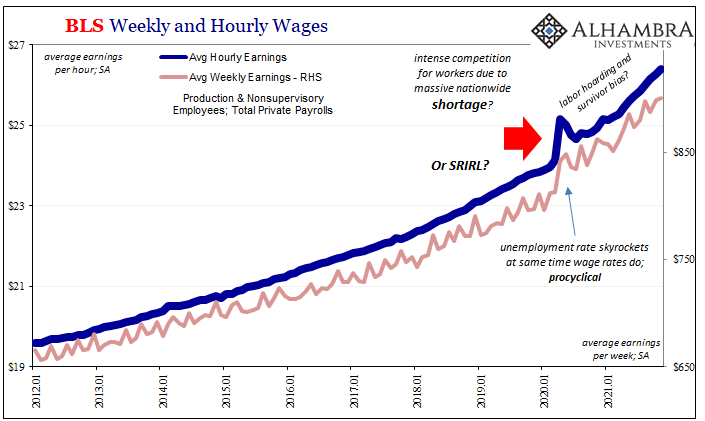
| Just what the FOMC needs in time for double taper, more ambiguity in the labor data (yesterday we examined the potential trick behind wage estimates).
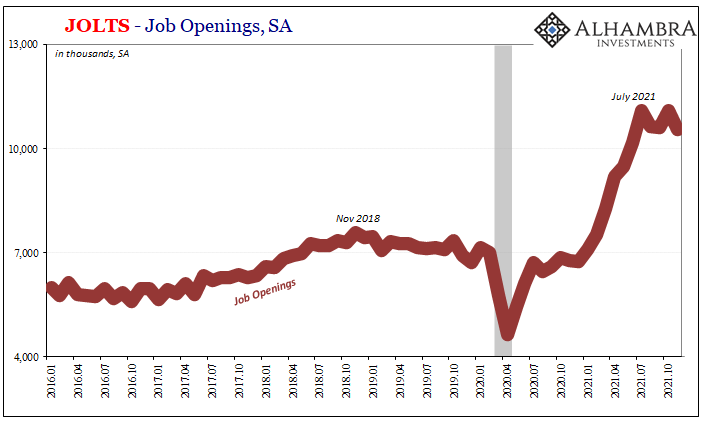
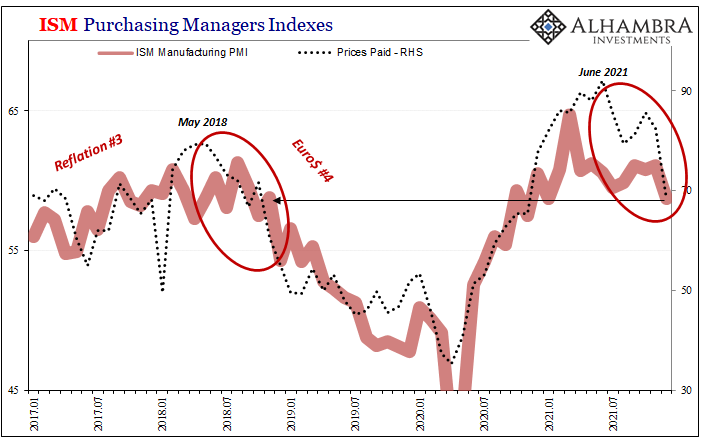
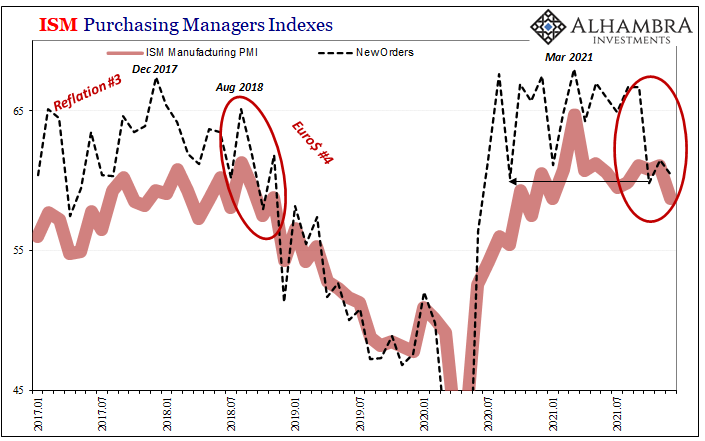
Before that, the data itself: Job Openings (JO) declined a fair amount, down a bit more than half a million, seasonally adjusted, October to November. At 10.56 million, that’s still wildly elevated, so the most important takeaway from the recent estimates is how they have peaked back around June and July. |
|
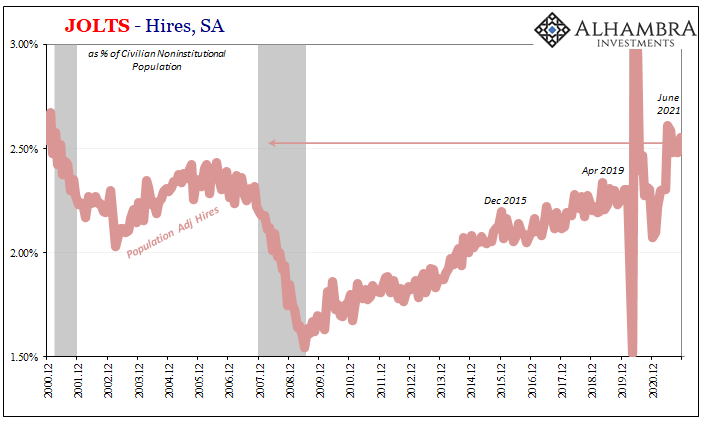
| The BLS believes the rate of hiring (HI) was rather good in November, too, 6.70 million, though not anywhere close (especially adjusting for population) to as good as JO pegs the demand for labor. There’s no reconciling these two without, probably, an entire overhaul of the data collection and crunching methods (a topic for another day; what might cause the alleged, by me, double-counting of JO).
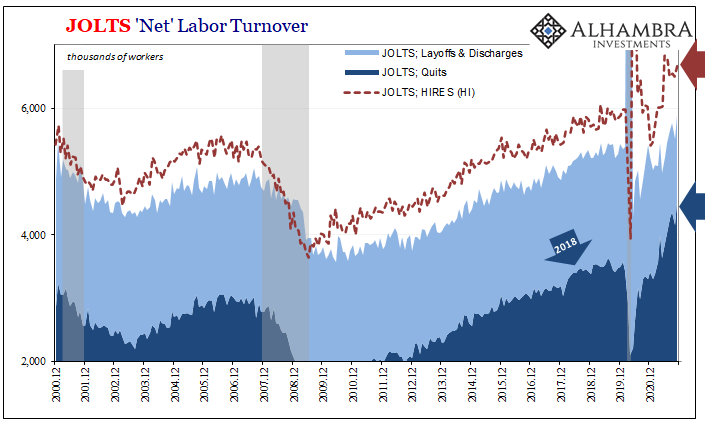
Moving away from JO vs. HI, another use for the rest of the JOLTS data is to sort of check the Establishment Survey (CES). As the name already implies, JOLTS comes at the monthly change in employment by way of monthly churn or turnover. To get there, we need only a couple additional series, quits and layoffs/discharges, along with a subjective adjustment factor to the result, most of the time, for the two, CES and JOLTS, to closely agree on the net change. |
|
The reasoning for these calculations is equally sound, as I wrote in April:
The BLS tells us that 6.697 million were hired (all numbers seasonally adjusted) during November while 1.369 million were laid off or fired, involuntarily separated in some way. A further and whopping 4.527 million voluntarily quit (we’ll come back to this). Altogether, that’s a net 801,000 gained – which is nothing like the thoroughly disappointing 210,000 (as of right now, revisions are coming Friday) increase in payrolls published already via the CES. But we’re getting ahead of ourselves; before comparing, we need to make that adjustment first. If you read through what I wrote in the article quoting myself above, I typically use a statistical factor of 300,000 because it works really well. Mostly. |
|
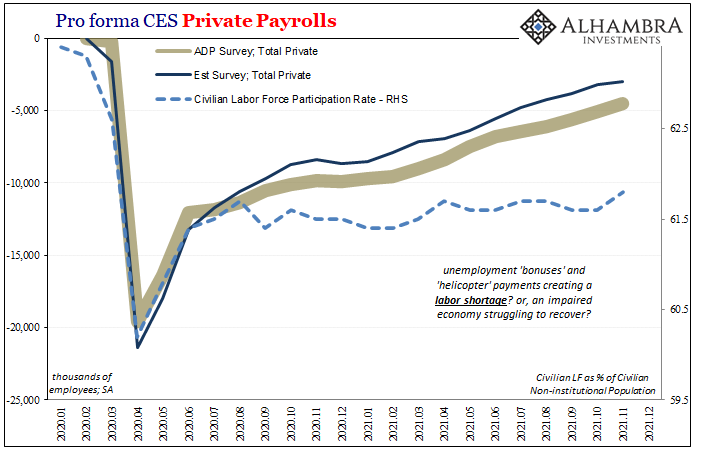
| However, there’s been some constant discrepancy since around 2012, and using that 300,000 plug, this would mean our labor turnover for November 2021 is adjusted down to 501,000 which is still not in the same ballpark as the Establishment Survey’s 210,000.
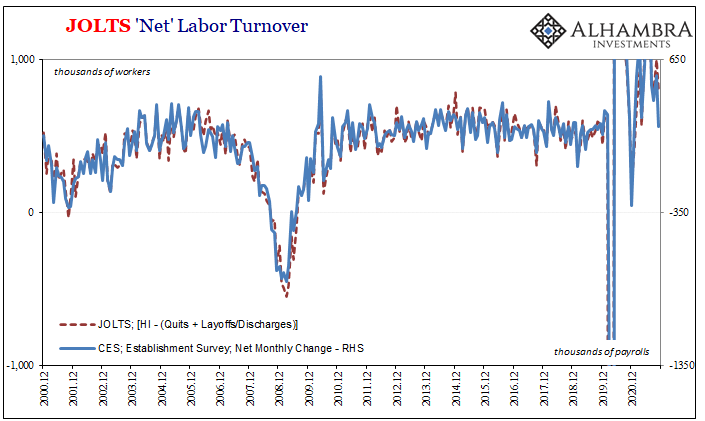
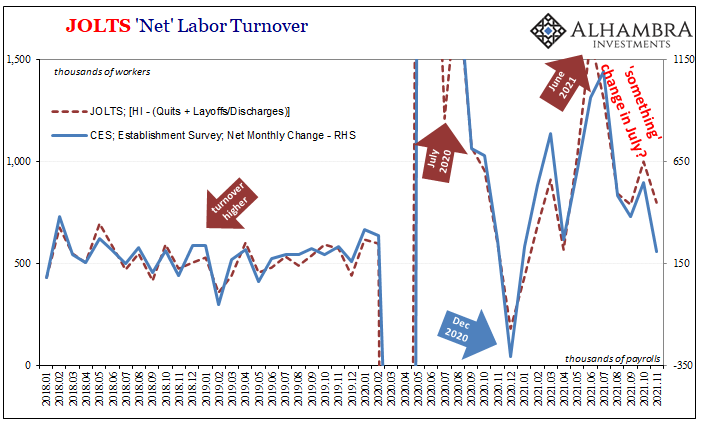
Even when we apply a factor of 350,000 rather than 300,000, it appears more of a fit to recent data yet, as you’ve no doubt calculated, it still leaves the various data for recent months well off from one another. This distance dates back to, surprise, surprise, right around June and July (note: charts below display the statistical factor of -350,000): |
|
| It can only be one of four possibilities (already eliminating the low likelihood there’s been more layoffs than what’s been figured): hiring hasn’t been as good as JOLTS estimates; the Establishment Survey has contrarily been too pessimistic; there is a statistical issue with one or both collections; or, more people have been quitting than even the large monthly amounts already tabulated over the past half year.
November was far, far away from the last of the federal government’s helicopters, so it seems unlikely for the vast majority that they’re quitting (and falling entirely out of the workforce, mind you) because they’re going on vacation or taking their time switching careers on what they have left of Uncle Sam’s dime after shopping so much on Amazon or paying any excess to oil companies via their local gasoline station. |
|
There are instead likely to be, in my view, potentially a whole lot more dissatisfied with their wage and pay, as I also speculated a few months ago:
So, there may be more quitters, a lot more, than JOLTS can actually keep up with, and this also fits quite neatly with the fact companies continue to refuse to pay the market clearing wage (thus, LABOR SHORTAGE!!!! that is actually a recovery shortage). And we can almost certainly add in more recent months the vaccine and/or masked mandates compelling even more workers toward the exits; especially if the real economy’s effective if hidden pay rates haven’t kept up even as SRIRL swirls in other labor data. |
|
| Given the way these JOLTS series are pieced together, this isn’t really implausible when such statistics find themselves in previously uncharted territory – as we’re seeing with Quits like JO.
With jobless claims effectively back to normal, we can no longer use those to check and verify which of JOLTS vs. CES is closer to the actual situation. But if you are Jay Powell, in lieu of knowing a single useful fact about effective money, attempting to stay ahead of inflation requires him and the FOMC to take these leaps of faith on indirect statistics – like JOLTS and the unemployment rate. Depend upon JO? Look at the net turnover and discard low payroll gains? What could possibly go wrong depending almost exclusively on these BLS for setting non-money monetary double taper and triple rate hikes? Oh yeah, repeating 2019 in 2022. |
|
| Depend upon JO? Look at the net turnover and discard low payroll gains?
What could possibly go wrong depending almost exclusively on these BLS for setting non-money monetary double taper and triple rate hikes? Oh yeah, repeating 2019 in 2022. |
|
Tags: currencies,economy,establishment survey,Featured,Federal Reserve/Monetary Policy,hires,job openings,jolts,Labor Market,layoffs,Markets,net turnover,newsletter,quits

