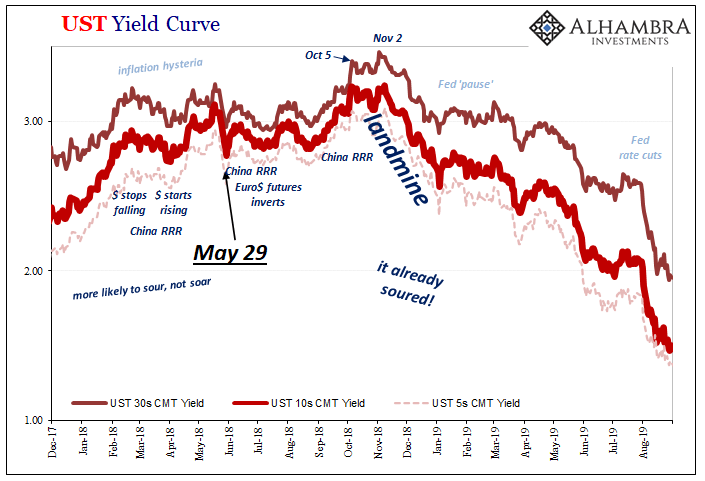
There were no surprises in today’s US GDP data. As expected, output sharply decelerated, modestly missing much-reduced expectations. The continuously compounded annual rate of change for Q3 2021 compared to Q2 was the tiniest bit less than 2% (1.99591%) given most recent expectations had been closer to 3%. It was only two months ago, mid-August, when the Blue Chip consensus pegged quarterly growth at better than 7%. Such a fast drop-off immediately brings up delta COVID, or consumer inflation. However, since this is very much in line with, well, pretty much everything else that’s come across going back further, back to around April and May, the GDP estimates and underlying supporting data only add more to the “growth scare” already being priced in bond markets
Topics:
Jeffrey P. Snider considers the following as important: 5.) Alhambra Investments, bonds, currencies, durable goods, economy, Featured, Federal Reserve/Monetary Policy, implicit price deflator, inflation, Inventory, Investment, Markets, newsletter, PCE, Personal Consumption Expenditures, real GDP, real private non-residential fixed investment, stimulus, stipends
This could be interesting, too:
Nachrichten Ticker - www.finanzen.ch writes Die Performance der Kryptowährungen in KW 9: Das hat sich bei Bitcoin, Ether & Co. getan
Nachrichten Ticker - www.finanzen.ch writes Wer verbirgt sich hinter der Ethereum-Technologie?
Martin Hartmann writes Eine Analyse nach den Lehren von Milton Friedman
Marc Chandler writes March 2025 Monthly
| There were no surprises in today’s US GDP data. As expected, output sharply decelerated, modestly missing much-reduced expectations. The continuously compounded annual rate of change for Q3 2021 compared to Q2 was the tiniest bit less than 2% (1.99591%) given most recent expectations had been closer to 3%. It was only two months ago, mid-August, when the Blue Chip consensus pegged quarterly growth at better than 7%.
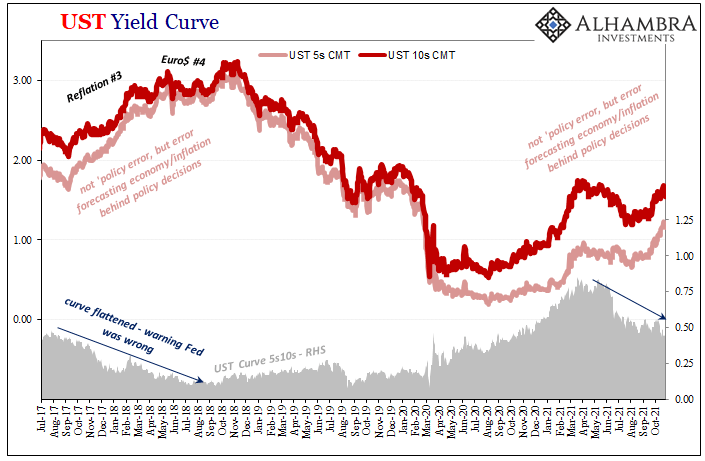
Such a fast drop-off immediately brings up delta COVID, or consumer inflation. However, since this is very much in line with, well, pretty much everything else that’s come across going back further, back to around April and May, the GDP estimates and underlying supporting data only add more to the “growth scare” already being priced in bond markets along with more high frequency data already having been leaning this same way. |
|
| To that end, the growing realization of potentially disturbing disappointment over “stimulus”; it was taken for granted how huge fiscal doses should have produced some lasting impact. Instead, it will be lucky to have kept up just to the end of this year, rather than the “red hot” economy believed to be unstoppable not so long ago.
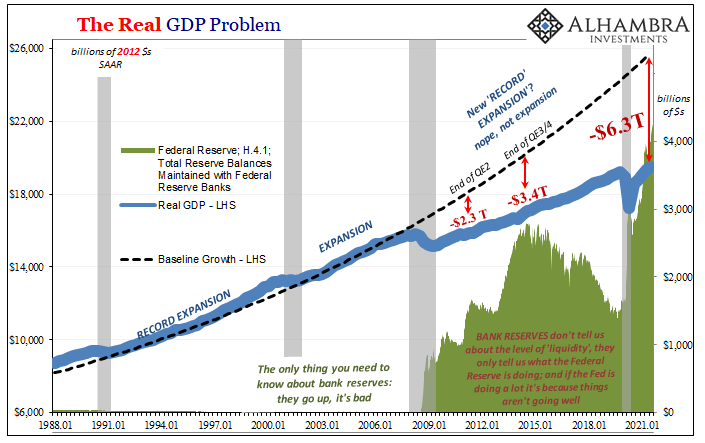
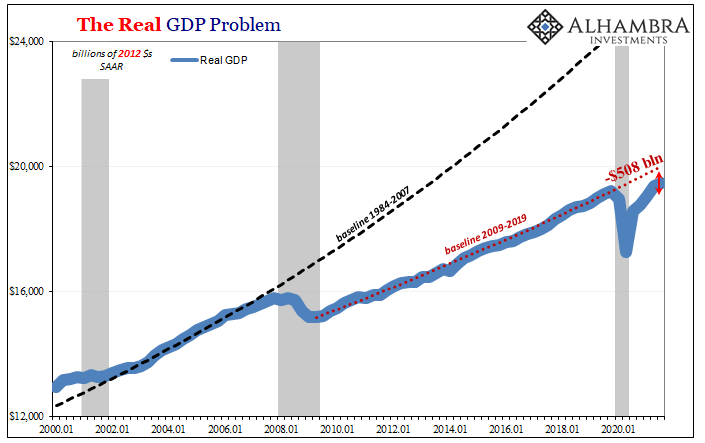
In real terms, Q3 real GDP remains more than a half a trillion below its pre-COVID baseline (annual rates), therefore a significant deficit to that minimum level of recovery (never mind the utterly mind boggling $6 trillion plus that’s missing on top – in just this one quarter – from the last time the economy broke). |
|
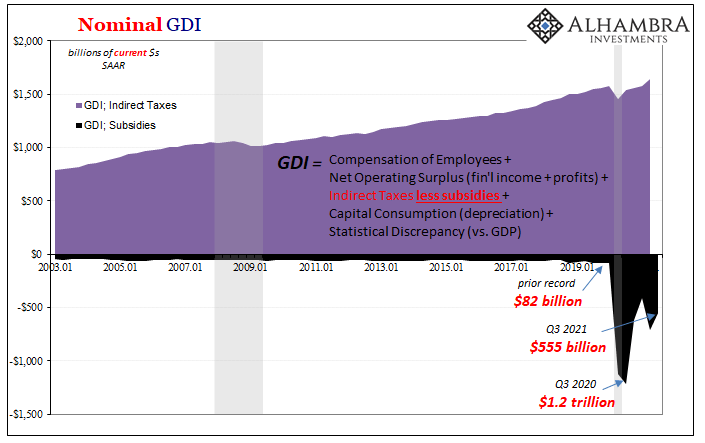
| What should be most concerning, especially in this same context of “stimulus”, is that this huge gap remains despite historic levels of government intervention (I’m neither including nor counting the QE fairy tale). In the GDP figures, meaning GDI, both the growth rate and the output gap suffered even with (annual rate) another half trillion in “stipends” flushed into the third quarter.That alone should be, but won’t be outside any honest interpretation of yields, a huge red flag. | |
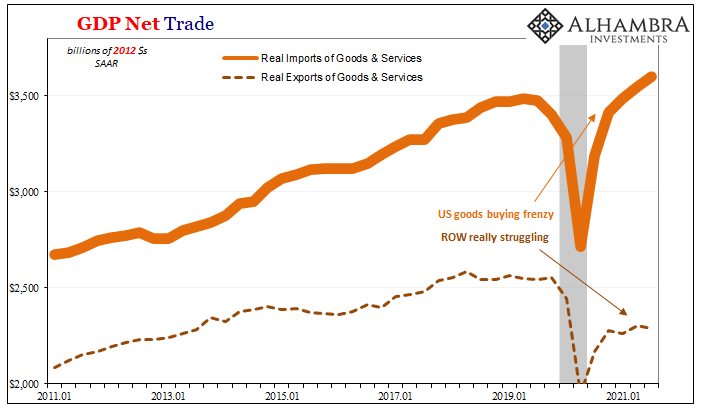
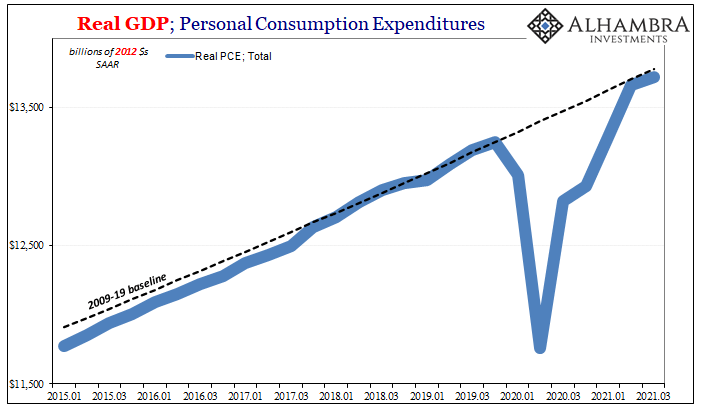
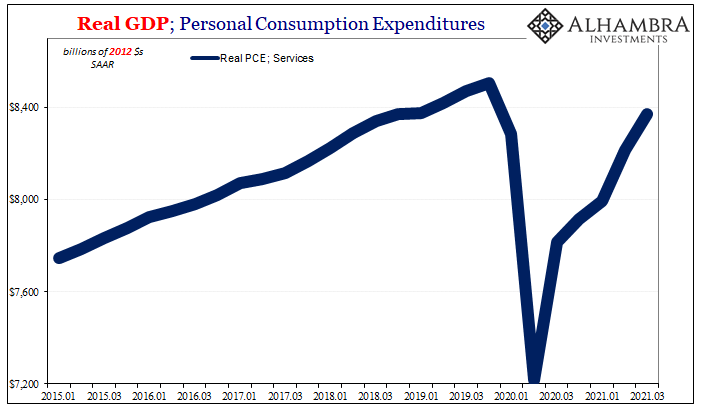
| These quarterly figures reflect changes and conditions already cited in the monthly data, in everything from PCE (personal consumption expenditures) to inventory levels and the huge global disparity between US-led goods buying and the otherwise awful recovery trends everywhere else (basically, imports vs. exports).
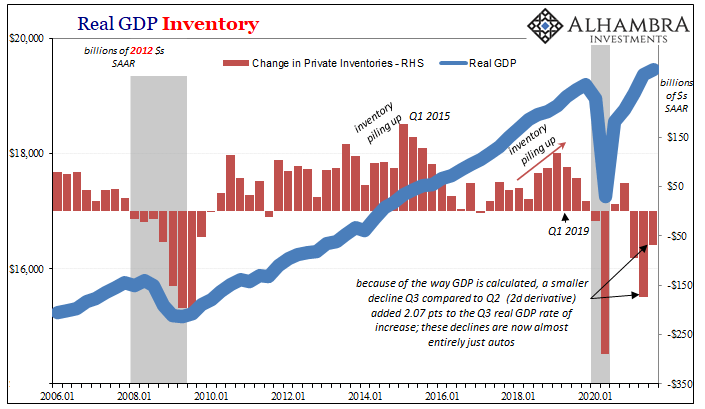
When it comes to inventory, according to the BEA aggregate investment in product declined by another $68 billion in Q3 when compared to a (revised) $174 billion drop during Q2. The way GDP is pieced together, the substantially smaller dip therefore added 2.07 points to the overall growth rate; meaning, without a huge increase in inventory in most parts of the goods economy, GDP was actually slightly negative (Real Final Sales was, coming in at -0.1% q/q). In other words, overall inventories declined because of what’s going on in the auto sector which is obscuring the underlying macro cycle tendencies. |
|
| We know auto inventories decreased somewhat more during the third quarter, but that other goods inventories continued to rise significantly (no matter how some empty shelves otherwise make it seem).
That last part was the inventory contribution in GDP. |
|
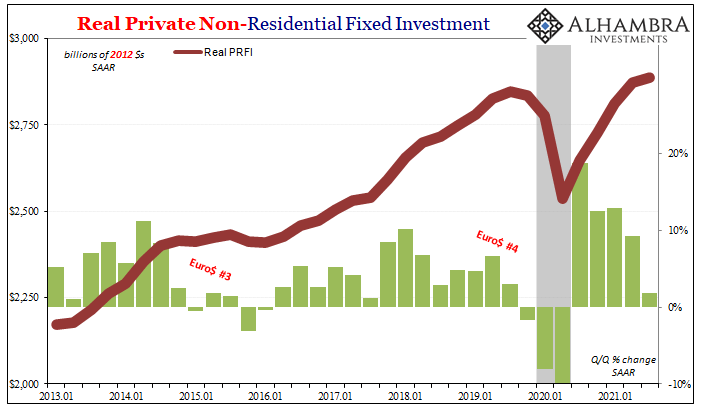
| The rest of the major components – trade, PCE, investment – nothing unexpected. The overall economy slowed down a lot in each, leaving those huge overall gaps cited above.
If nothing more than delta corona or just fears of it, then Q3’s downtick as bad as it was (given the lack of progress closing those gaps) wouldn’t be anything more than transitory. The delta wave having largely disappeared (at least where it had been most prevalent during those three months), the system should easily get back on track. Even if it is the disease case, though I certainly don’t believe it has been, just what “track” is the economy going back on? Most widely believe it is a recovery trajectory when, factoring stipends, it couldn’t manage to do so even with them. |
|
| And if the latter, hopped up further on non-auto inventory, the slowdown might stick around regardless of the pandemic’s pattern of ups and downs. | |
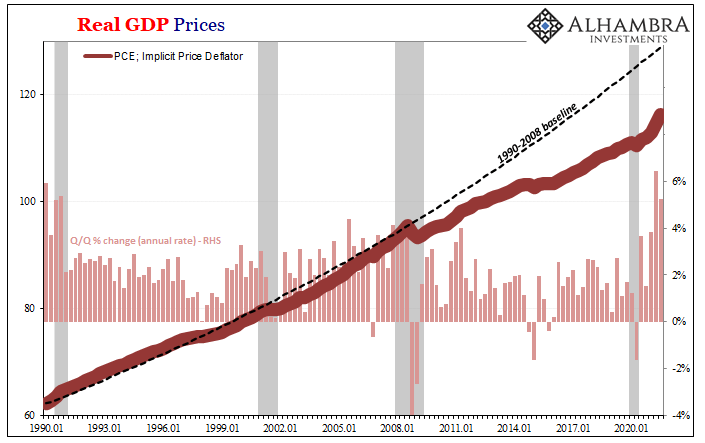
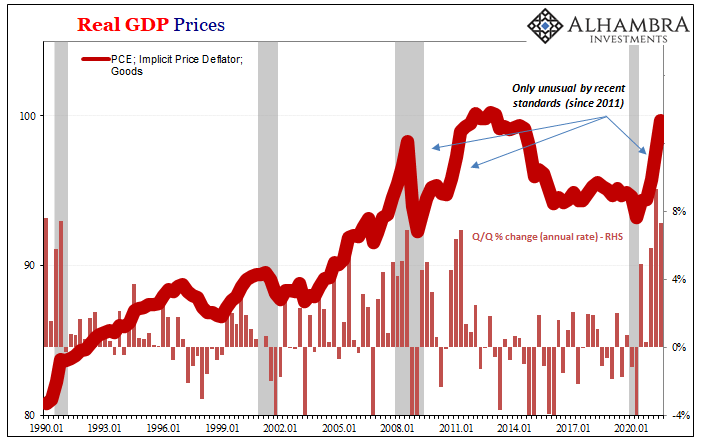
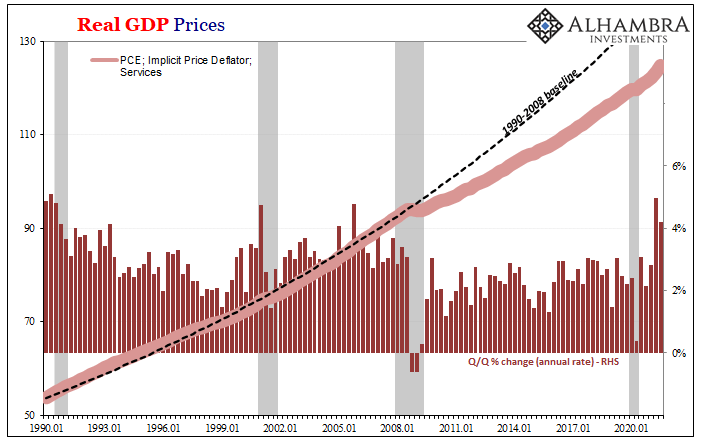
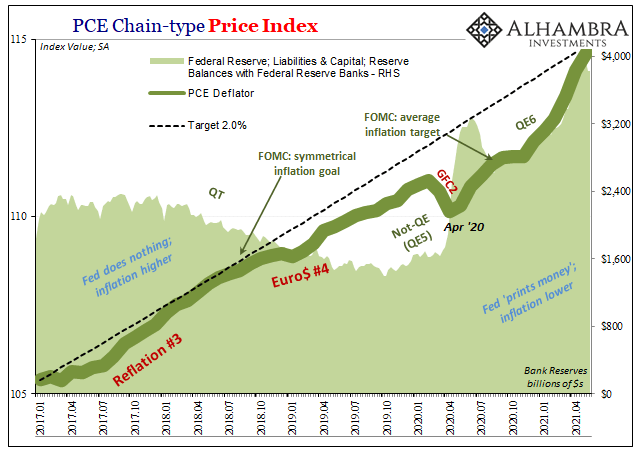
| This only leaves us with “inflation.” As with all the other GDP estimates, the price deflators in the consumer segment turned somewhat lower in Q3 when compared to Q2. That is, the rate of increase (prices still went up; another second derivative) was slightly diminished, further pointing to their transitory (non-money) factors.
And if the economy really is slowing down to its non-recovery baseline, especially as “stipends” fade further, Q3’s deflator indices would then mark Q2 as the consumer price level peak with downside already apparent in the monthly inflation estimates – particularly if goods spending continues to soften while inventory everywhere other than automobiles keeps getting delivered to whichever parts of the supply chain hadn’t anticipated “stimulus” only manifesting a couple quarters of the same demand. Not much to consider here, merely putting some useful numbers and context on where things stand as of the end of September. |
|
| What those things mean moving forward, this depends on your view of stipends, COVID, and legitimate economic potential. | |
Tags: Bonds,currencies,durable goods,economy,Featured,Federal Reserve/Monetary Policy,implicit price deflator,inflation,Inventory,investment,Markets,newsletter,PCE,personal consumption expenditures,real GDP,real private non-residential fixed investment,stimulus,stipends

