Given that political power in America is a pay-to-play auction in which the highest bidder wins, how this incomprehensibly lopsided ownership of wealth plays out is an open question. Wealth inequality easily falls into an abstraction unless we contextualize it in meaningful ways. I’ve annotated two St. Louis Federal Reserve (FRED) charts–the net worth of America’s top 1% and the net worth of America’s bottom 50% of households, roughly 66 million households–to show their net worth and their share of all household net worth, and put this in the context of inflation and GDP (gross domestic product) of the U.S. and other nations. These charts may look complicated but the idea is actually pretty simple: I’ve noted how each group (the top 1% and the bottom 50%) did at
Topics:
Charles Hugh Smith considers the following as important: 5.) Charles Hugh Smith, 5) Global Macro, Featured, newsletter
This could be interesting, too:
Nachrichten Ticker - www.finanzen.ch writes Die Performance der Kryptowährungen in KW 9: Das hat sich bei Bitcoin, Ether & Co. getan
Nachrichten Ticker - www.finanzen.ch writes Wer verbirgt sich hinter der Ethereum-Technologie?
Martin Hartmann writes Eine Analyse nach den Lehren von Milton Friedman
Marc Chandler writes March 2025 Monthly
| Given that political power in America is a pay-to-play auction in which the highest bidder wins, how this incomprehensibly lopsided ownership of wealth plays out is an open question.
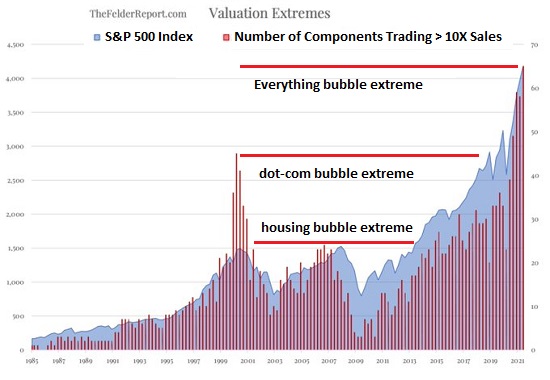
Wealth inequality easily falls into an abstraction unless we contextualize it in meaningful ways. I’ve annotated two St. Louis Federal Reserve (FRED) charts–the net worth of America’s top 1% and the net worth of America’s bottom 50% of households, roughly 66 million households–to show their net worth and their share of all household net worth, and put this in the context of inflation and GDP (gross domestic product) of the U.S. and other nations. These charts may look complicated but the idea is actually pretty simple: I’ve noted how each group (the top 1% and the bottom 50%) did at the top and bottom of each bubble: the dot-com bubble in 2000, the stock/housing bubble that topped in 2007, and the current bubble, noting the pre-pandemic data at the end of 2019 and the most recent totals (2nd quarter 2021). Next, I pose a simple question: if the net worth of each group had tracked the growth of America’s GDP (i.e. its real economy), where would its net worth be now? All else being equal, the assumption that net worth would rise more or less in lockstep with the expansion of the entire economy makes sense. I note both the dollar amount of each group’s net worth and their share of total household wealth to track their slice of wealth relative to the entire pie of wealth and to each other’s slice. In other words, as the net worth pie expands, does each group expand its share of the pie or not? |
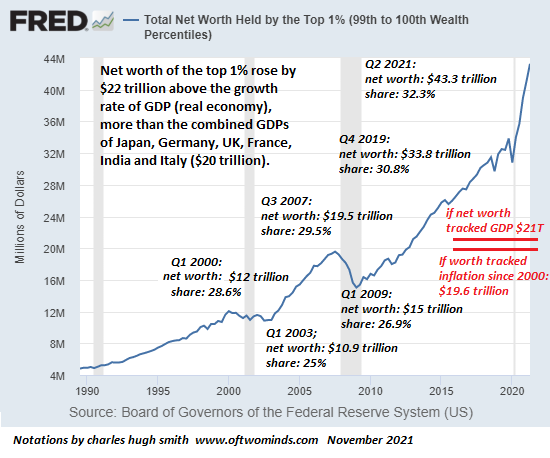 . |
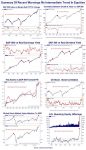
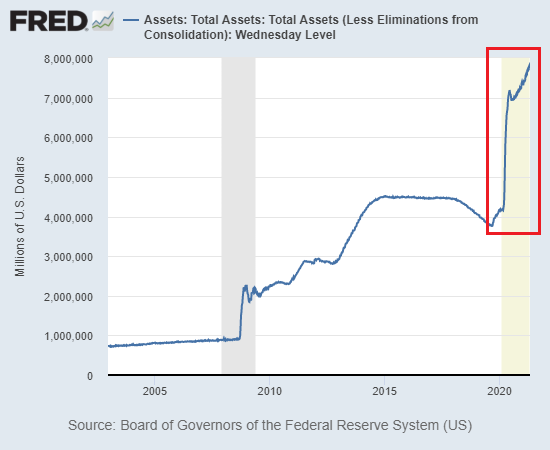
| What we find is a stunning asymmetry: if the top 1%’s net worth has risen along with GDP since 2000, it would now be about $21 trillion. Instead, it’s now over $43 trillion, a $22 trillion gain above where it would be had it tracked GDP growth.
For context, this is larger than the GDP of the U.S. ($21 trillion) and the combined GDPs of the six largest economies behind the U.S. and China: Japan, Germany, UK, France, India and Italy In other words, the $22 trillion gained by America’s top 1% as a result of Federal Reserve bubble-blowing is literally beyond comprehension: s sum larger than entire economies, a sum totally disconnected from America’s real-world economic expansion. Note that the top 1%’s share of total wealth has increased with every bubble: even as the pie of wealth expanded, the top 1%’s share has increased to roughly one-third of all wealth, which includes vehicles, homes, financial assets, etc. (The top 1% owns the majority of all financial assets.) In comparison, the bottom 50%, despite recent gains resulting from the housing bubble, has only tracked GDP: where the top 1% more than doubled its wealth above where it would have been had it risen along with GDP, the bottom 50% have barely kept up with GDP’s expansion. If it wasn’t for the current housing bubble, the bottom 50%’s wealth wouldn’t even have kept up with GDP. |
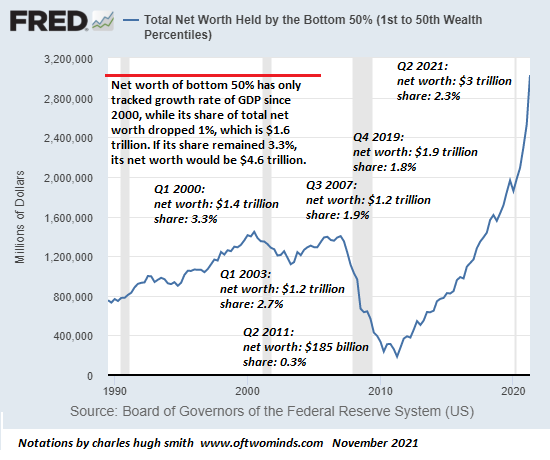 . |
| The bottom 50% has lost ground in terms of its share of total household net worth: its already-marginal 3.3% of total wealth in 2000 has slipped to an inconsequential (i.e. signal-noise) 2.3%.
If the bottom 50% had maintained its meager 3.3% share, its net worth would be higher by $1.6 trillion–1% of the total net worth of U.S. households ($160 trillion). That’s 50% higher than its current net worth of $3 trillion. Note how the housing bubble bursting in 2008-09 basically destroyed the wealth of the bottom 50% whose primary asset (if any) is a home. Net worth of the bottom 50%–over 60 million households– fell to a near-zero $185 billion in 2011 at the nadir of the housing market. The top 1%’s fortunes have climbed in a series of higher lows and much higher highs: each spot of bother (collapse of the bubble du jour) dented the net worth of the top 1%, but their wealth never even declined to previous troughs. At the bottom of the oh-so horrendous market drop in 2020, the top 1%’s wealth was still double what it had been at the trough in 2009, $30 trillion vs. $15 trillion. |
 . |
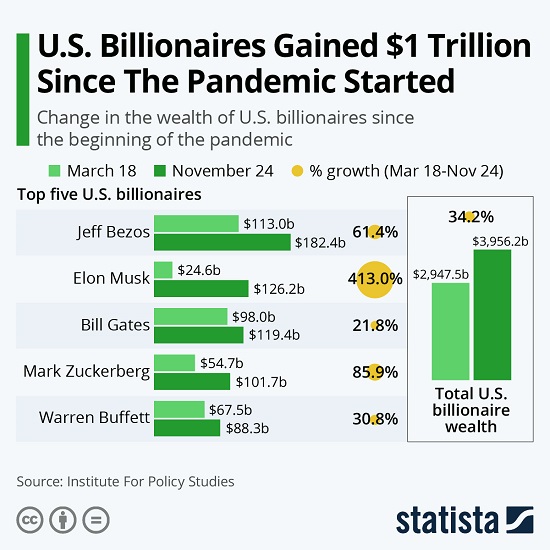
| All of this upward shift of wealth accelerates as we approach the apex of wealth-power: a handful of billionaires own more than the bottom 50% (by some measures, the asymmetry is even worse than depicted by FRED data.)
Given that political power in America is a pay-to-play auction in which the highest bidder wins, how this incomprehensibly lopsided ownership of wealth plays out is an open question. The pendulum of wealth-power concentration has reached an extreme, and when it swings back, it will reach an equally extreme position at the other end of the spectrum. |
 . |
You Might Also Like
Eight Reasons Scarcities Will Increase Rather Than Evaporate
2021-11-09
Who knew it would be so easy? All we have to do is collect urine and we’ll be flying our electric air taxi tomorrow! While the private-jet crowd is busy selling a future of 1 billion electric vehicles, 1 billion windmills, 1 billion solar arrays, hundreds of thousands of electric aircraft, thousands of new nuclear power plants and trillions more in "wealth" accumulating in their bloated ledgers, reality is intruding on their technocratic fantasies.
 Revenge of the Real World
2021-11-04
The status quo response would be amusing if the consequences weren’t so dire. Rather than stare at empty shelves, you have two options for distraction: you can don a virtual-reality headset and cavort with dolphins in the metaverse, or you can trade various forms of phantom wealth that always go up (happy happy!) because the Fed.
 Now That the American Dream Is Reserved for the Wealthy, The Smart Crowd Is Opting Out
2021-09-22
The already-wealthy and their minions are unprepared for the Smart Crowd opting out. Clueless economists are wringing their hands about the labor shortage without looking at the underlying causes, one of which is painfully obvious: the American economy now only works for the top 10%; the American Dream of turning labor into capital is now reserved for the already-wealthy.
 Please Don’t Pop Our Precious Bubble!
2021-09-09
It’s a peculiarity of the human psyche that it’s remarkably easy to be swept up in bubble mania and remarkably difficult to be swept up in the same way by the bubble’s inevitable collapse.
 Have We Reached “Peak Self-Glorifying Billionaire”?
2021-07-22
Perhaps we should update Marie Antoinette’s famous quip of cluelessness to: “Let them eat space tourism.” As billionaires squander immense resources on self-glorifying space flights, the corporate media is nothing short of worshipful. Millions of average citizens, on the other hand, wish the self-glorifying billionaires had taken themselves and all the other parasitic, tax-avoiding, predatory billionaires with them on a one-way trip into space.
 Virus Z: A Thought Experiment
2021-07-04
Let’s run a thought experiment on a hypothetical virus we’ll call Virus Z, a run-of-the-mill respiratory variety not much different from other viruses which are 1) very small; 2) mutate rapidly and 3) infect human cells and modify the cellular machinery to produce more viral particles.
 Systemic Risks Abound
2021-05-27
For the past 22 years, every time the stock market whimpered, wheezed or whined, the Federal Reserve rushed to soothe the spoiled crybaby. There are two consequential results of the Fed as savior: The Fed has perfected moral hazard. Organic (i.e. non-manipulated) market forces have been extinguished.
 Fed to Treasury Dealers and Congress: We Can’t Count On You, We’re Taking Charge
2021-05-25
The Fed sees itself as trapped by the incompetence and greed of the other players and by its own policy extremes that were little more than expedient “saves” of a system that is unraveling due to its fragility and brittleness.
Tags: Featured,newsletter